Deep Learning Assessment of Tumor Proliferation in Breast Cancer Histological Images
To be done
1, receptive field 的计算https://www.cnblogs.com/objectDetect/p/5947169.html
2, layer数的计算
This paper was submitted to CVPR2016. Here is the link .This study presents the dirst data-driven approach to characterize the severity of tumor groeth on a categorical and molecular level.,utilizing multiple biologically salient deep learning classifiers.
- dataset : Three dataset were used in this study. you can find the detailed information in this link. The primary dataset consists of 500 breast cancer cases. Each case is represented by one whole-slide image (WSI) and is annotated with a proliferation score (3 classes). The first auxiliary dataset consist of 73 images. Regions that contain mitotic figures with be marked,So it can be used train a mitosis detection model. The second suxiliary dataset consists of 148 images. Regions of interst of each image will ne marked.So it can be used to train a region of interest model.
- target : predict tumor proliferation score based on mitosis counting.
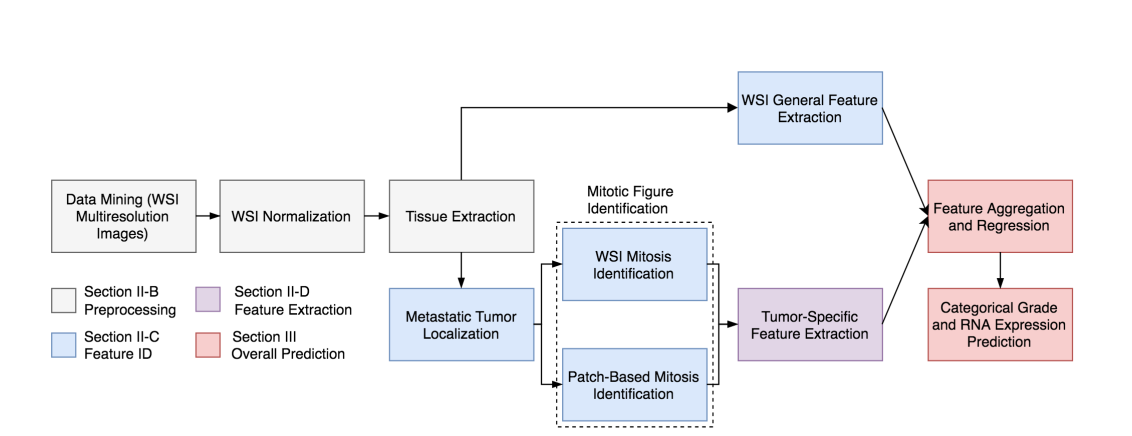
1, WSI normalization, and tissue extraction
2, Train a FCN-1 based on the second auxiliary dataset to do tumor localization.
The input is 1000*1000 pixels patch, the output is a 63*63 heatmap. As each images contained a non-exhaustive list of tumor regions.We, therefore separated the process into two components,with the first stage defining annotated patches as positive and identifying a random sample of remaining tissue patches as negative. Heatmaps were subsequently produced using each model and additional regions predicted as positive with over 95% confidence were appended to the initial positive training set. All models were retrained with the refined data; subsequent second stage results better eliminated regions misclassified in the first stage
3, Train another FCN-2 based the first auxiliary dataset.the training method is the same as before.
4, Train a CNN based on FCN-1 or FCN-2 to do WSI general feature extraction(see Fig.2).(难点)
Patches are extracted from original WSIs and input to the first network (with static weights) which computes coarse features corresponding to either mitosis identification or tumor localization. Convolutions from the first network’s feature volume are next mapped to the input of a second network (with dynamic weights). The second network performed categorical predictions and extracted WSI features. These 1,024 features, combined with 3 predicted class probabilities, were incorporated in the final predictive model.
5,Tumor-specific feature extraction(see Fig.2).
1), we preferentially selected fifty patches(1k*1k) from the fringes of localized tumor regions with the largest area. We make the patches as the input to FCN-2 to get a comprehensive heatmap which will be used as WSI global feature.
2), data-driven features: for each patch(1k*1k), we will get multiple 63*63 mitotic patches. and Each mitotic patch was subsequently characterized by 4,096 attributes to describe mitosis-specific structural minutiae. As each patch consisted of mitotic figures and was thereby associated with 4096× distinct computational attributes, feature standardization was performed. We conducted post-processing k-means clustering on all individual mitosis feature vectors (of length 4,096) from every WSI patch in a 200-dimensional vector space. Each vector was associated with a cluster label 2 [1; 200] identifying its most similar sub-space. Finally, each WSI was distilled into a 200-bin histogram with frequencies corresponding to the cluster labels of each mitotic region within extracted patches, resulting in a fixed data-driven feature vector of length 200.(难点)
3), biological features.
总结:
这篇文章理解时间较长,主要是一直没有注意到训练两个FCN网络的data,与做评分的data不一致,且训练好的网络可以在后续过程做 feature extraction 的工作。