目录
一、效果图预览

二、准备
1.JavaScript源码运行文件,用以运行代码
需要运行文件的自行下载
http://链接:https://pan.baidu.com/s/1shmtM36HgRqC0S1OXpNWpg?pwd=yozs提取码:yozs --来自百度网盘超级会员V2的分享
https://pan.baidu.com/s/1shmtM36HgRqC0S1OXpNWpg?pwd=yozs
2.需要文本编辑器如notepad++
好用的文本编辑器能够使编辑和查错更方便,当然也可以用记事本进行编辑。
三、编写图像属性代码
1.编辑界面预览
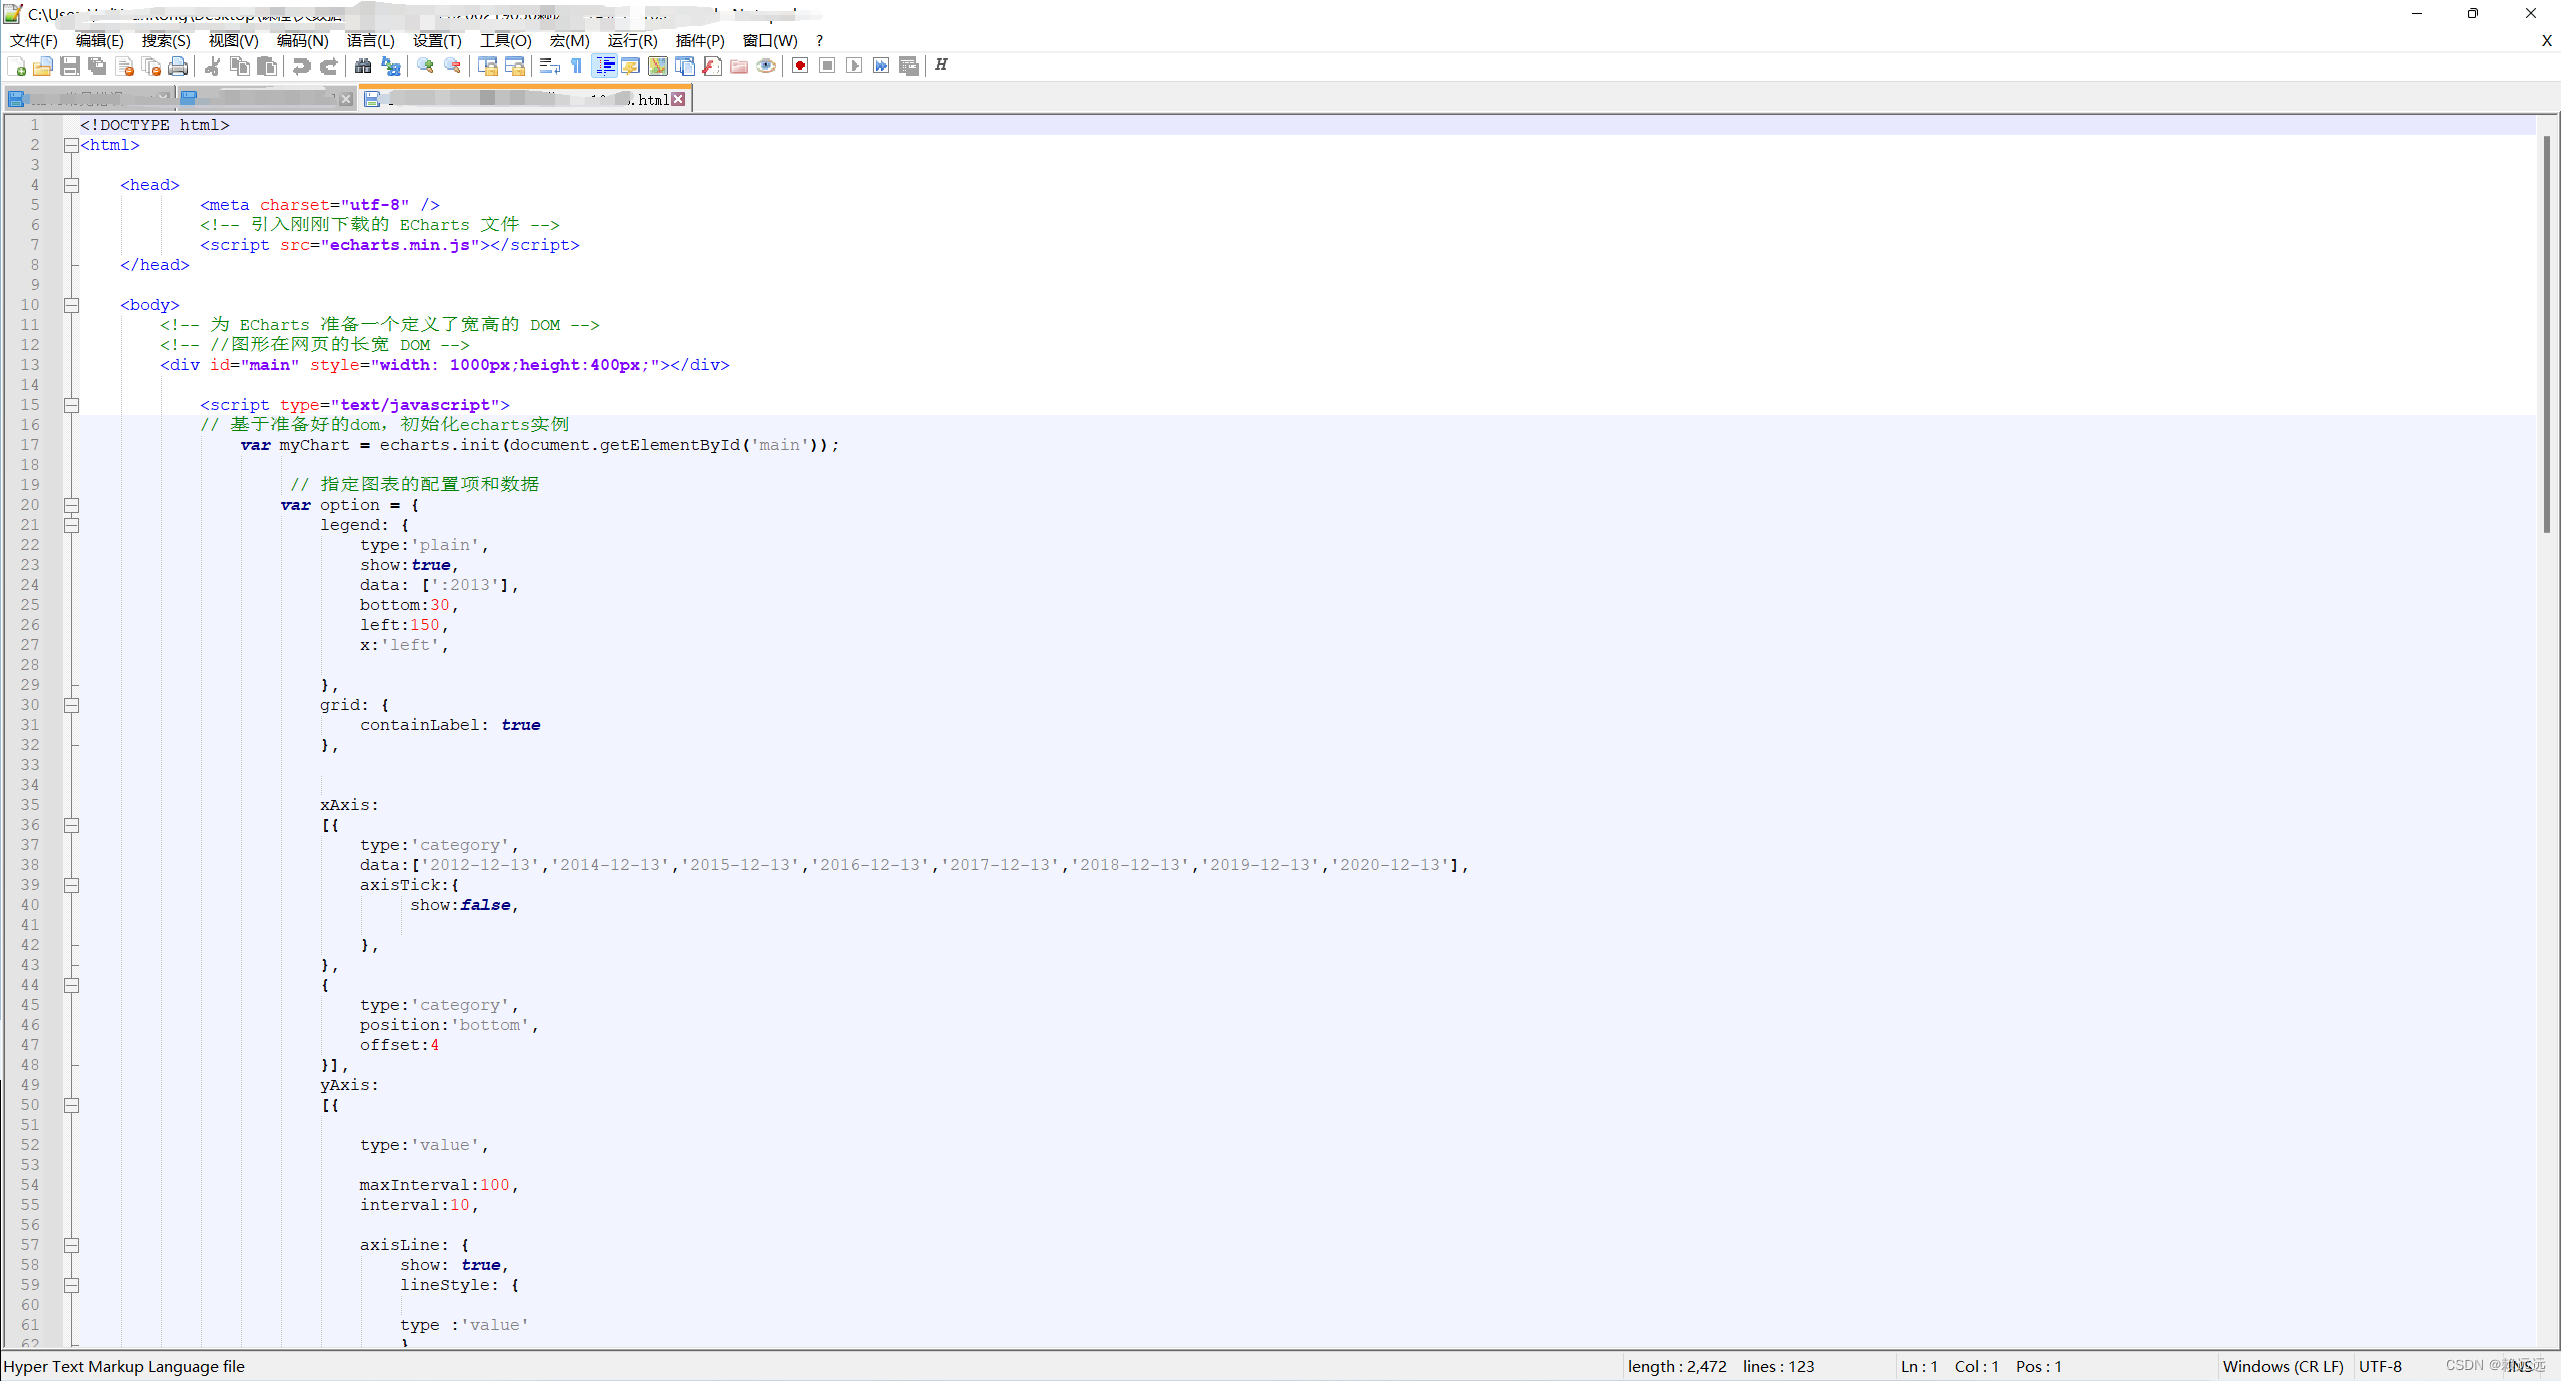
2.完整代码
<!DOCTYPE html>
<html>

	<head>
    		<meta charset="utf-8" />
    		<!-- 引入刚刚下载的 ECharts 文件 -->
    		<script src="echarts.min.js"></script>
  	</head>

	<body>
  		<!-- 为 ECharts 准备一个定义了宽高的 DOM -->
		<!-- //图形在网页的长宽 DOM -->
  		<div id="main" style="width: 1000px;height:400px;"></div>

			<script type="text/javascript">
			// 基于准备好的dom,初始化echarts实例
				var myChart = echarts.init(document.getElementById('main'));

					 // 指定图表的配置项和数据
					var option = {
						legend: {
							type:'plain',
							show:true,
							data: [':2013'],
							bottom:30,
							left:150,
							x:'left',

						},
						grid: {
							containLabel: true
						},


						xAxis:
						[{
							type:'category',
							data:['2012-12-13','2014-12-13','2015-12-13','2016-12-13','2017-12-13','2018-12-13','2019-12-13','2020-12-13'],
							axisTick:{
								 show:false,

							},
						},
						{
							type:'category',
							position:'bottom',
							offset:4
						}],
						yAxis:
						[{

							type:'value',

							maxInterval:100,
							interval:10,

							axisLine: {
								show: true,
								lineStyle: {

								type :'value'
								}
							},


							axisTick: {
								show: false
							},
							splitLine:{
								show:true,
								lineStyle: {
										color:'#000000',
										width:0.5
								}

							},
							axisLabel: {
								 formatter: '{value} %'
							},
							boundaryGap: false
						},
						{
							type:'category',
							position:'left',
							offset:4
						}
						],

						tooltip:{},
						series:
						[
							{
								name: ':2013',
								type:'line',
								symbolSize: 7,
								symbol:'circle',
								color:'purple',
								//smooth: true,
								data:[5,5,80,10,30,30,60,10],
								label:{
									show:true,
									position:'bottom',
									textStyle:{
										collor:'#000',
										fomSize:16
									},
								//添加单位
								formatter:function(params){
									return (params.value)+"%"
								}
								},
							}
						]//series_end

					};//option_end

					  // 使用刚指定的配置项和数据显示图表。
					  myChart.setOption(option);
		</script>

	</body>

</html>
编辑完成后需要保存为html文件,否则无法运行。
四、运行
注意:html文件需要和js文件在同一个目录下,否则图像代码编辑当中引入ECharts文件时就需要指定路径。
浏览器打开html文件即可查看运行结果。
想要了解和学习更多图形配置项可浏览Echarts官网
Documentation - Apache ECharts
最后,如果内容对你有帮助,不妨点个赞!!