echarts 双折线图 实线与虚线
请引入echarts
在main 文件中
//echarts
import echarts  from 'echarts';
import 'echarts-gl'
Vue.prototype.$echarts= echarts ;
Vue.use(echarts);
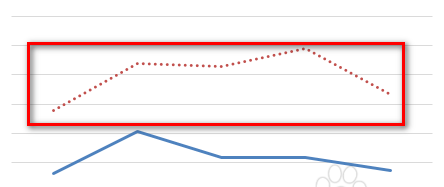
效果图
实现代码
<template>
    <div>
        双折现
        <div id="main"></div>
    </div>
</template>
<script>
export default {
    props:['lines'],
    data(){
      return{

      }
    },
    mounted(){
        var data = {
            title: ['总计', '12-01', '12-02', '12-03', '12-04', '12-05', '12-06', '12-07', '12-08', '12-09'],
            plan_production: [500, 300, 490, 333, 346, 777, 888, 864, 789, 765],
            actual_production: [300, 400, 500, 300, 400, 500, 300, 400, 500, 500],
            attainment_rate: [60, 80, 90, 60, 70, 80, 90, 60, 70, 90],
            productivity: [30, 45, 88, 100, 110, 70, 80, 90, 100, 100]
        };

        for (var pr in data) {
            data[pr] = data[pr].slice(1, -1);
        }

        function getTableLine(num) {
            var list = [];
            var bottom = 122;
            // 行的高度
            var height = 20;
            for (var i = 0; i < num; i++) {
                list.push({
                    type: 'line',
                    bottom: bottom - i * height,
                    // 偏移量
                    right: 80,
                    style: {
                        fill: '#333'
                    },
                    shape: {
                        x1: 0,
                        y1: 0,
                        // 控制坐标做线条
                        x2: 0,
                        y2: 0
                    }

                });
            }
            return list;
        }
       // getTableLine参数代表行
        var lineList = getTableLine(3);
       // 获取页面标签
       var myChart = this.$echarts.init(document.getElementById('main'));
        //指定图标的配置和数据
         myChart.setOption({


        title: [{
            text: '\n实际产出\n达成率\n生产效率',
            bottom: 72,
            left: 10,
            textStyle: {
                lineHeight: 20,
                fontSize: 13,
                fontWeight: 'normal',
                formatter: function(value) {
                    return '{table|' + value + '}';
                },
                rich: {
                    table: {
                        align: 'center'
                    }
                }
            }
        }],
        // 图表范围
    grid: {
        bottom: 150,
        left: 80,
        right: 80
    },
    xAxis: [{
        type: 'category',
        boundaryGap: true,
        data: data.title,
        axisTick: {
            // 控制表格高度
            length: 70
        },
        axisLabel: {
            formatter: function(value, index) {
                return '{table|' + value +'}\n{table|' + data.plan_production[index] + '}\n{table|' + data.actual_production[index] +'}';
            },
            rich: {
                table: {
                    lineHeight: 20,
                    align: 'center'
                }
            }
        }
    }],
    yAxis: [{
        type: 'value',
        // show : false,
        scale: false,
        minInterval: 1,
        name: '数量',
        // 取消 y 轴刻度
        axisTick: {
          show: false
        },
        // 控制 y 轴网格线
        splitLine: {
            show: true
        },
        // 取消 y 轴保留网格线
        axisLine:{
            show: false
        },
        // min: function(v) {
        //     return Math.max((v.min - 10), 0);
        // }
    }],
    // 图表类型及数据填充
    series: [
    {
        name: '达成率',
        type: 'line',
         //  smooth位false,为true是不支持虚线,实线就用true
        smooth:false,
        itemStyle:{
            normal:{
                lineStyle:{
                    // 设置线的宽度
                   width:1,
                   //'dotted'虚线 'solid'实线
                   type:'dotted'
                }
            }
        },
        label: {
            show: true,
            position: 'top',
            formatter: '{c} %'
        },
        // 控制y轴方向是在右边是左边 0 是右面  1是左边
        yAxisIndex: 0,
        data: data.attainment_rate
    },
    {
        name: '生产效率',
        type: 'line',
        label: {
            show: true,
            position: 'top',
            formatter: '{c} %'
        },
        yAxisIndex: 0,
        data: data.productivity
    }],
    graphic: lineList


        });
    }
}
</script>
<style scoped>
 #main{
   width:100% ;
   height:25rem;
 }
</style>