import React, { Component, createRef } from 'react'
import { Cart } from 'antd'
import echarts from 'echarts'
var option = {
// 图表名
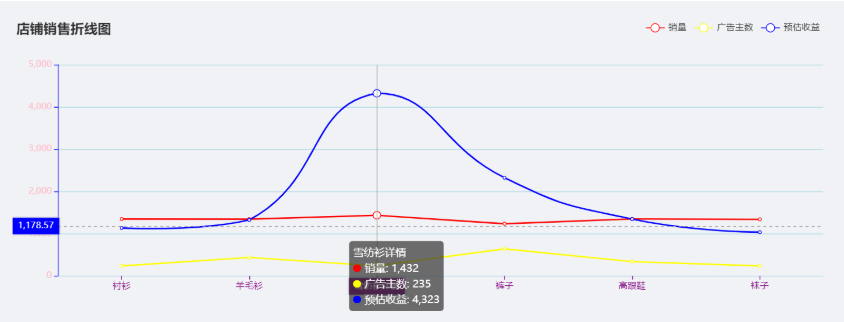
title: {
text: '店铺销售折线图'
},
tooltip: {
trigger: 'axis', //开启tips框框
axisPointer: {type: 'cross'} //y轴刻度跟随鼠标显示
},
color:["red", "yellow", "blue"],
// 顶部说明
legend: {
data:['销量','广告主数','预估收益'],
left:'right' // 对齐方式
},
// 设置折线图大小
grid: {
top: 60, // 主图距离整个容器顶部的距离
left:60,
right:0,
bottom: 60
},
// x轴刻度
xAxis: {
type: 'category',
axisTick: {
alignWithLabel: true
},
axisLine: {
onZero: true,
lineStyle: {
color: 'purple',
width:'92%'
}
},
axisPointer: {
label: {
//相当于tips的标题
formatter: function (params) {
return params.value+'详情';
}
}
},
data: ["衬衫","羊毛衫","雪纺衫","裤子","高跟鞋","袜子"]
},
yAxis: [{
type: 'value',
//刻度对出去的线的颜色
splitLine:{
lineStyle:{
color:'lightblue'
}
},
axisLabel: {
color: "pink" //Y轴刻度字颜色
},
axisLine: {
lineStyle: {
// 设置y轴轴线颜色
color: 'blue'
}
}
}],
series: [{
name: '销量', // 折线名
type: 'line',
data: [1344, 1342, 1432, 1232, 1346, 1336]
}, {
name:'广告主数',
type:'line',
smooth: false,
data: [232, 433, 235,636, 334, 233]
},
{
name:'预估收益',
type:'line',
smooth: true, // true曲线 false折线
data: [1133, 1323, 4323, 2323, 1343, 1033]
}
]};
export default class index extends Component {
constructor(){
super()
this.chartRef = createRef()
}
componentDidMount(){
let myChart = echarts.init(this.chartRef.current)
myChart.setOption(option)
}
render() {
return (
<div>
<div ref={this.chartRef} style={{height:"400px"}}></div>
</div>
)
}
}