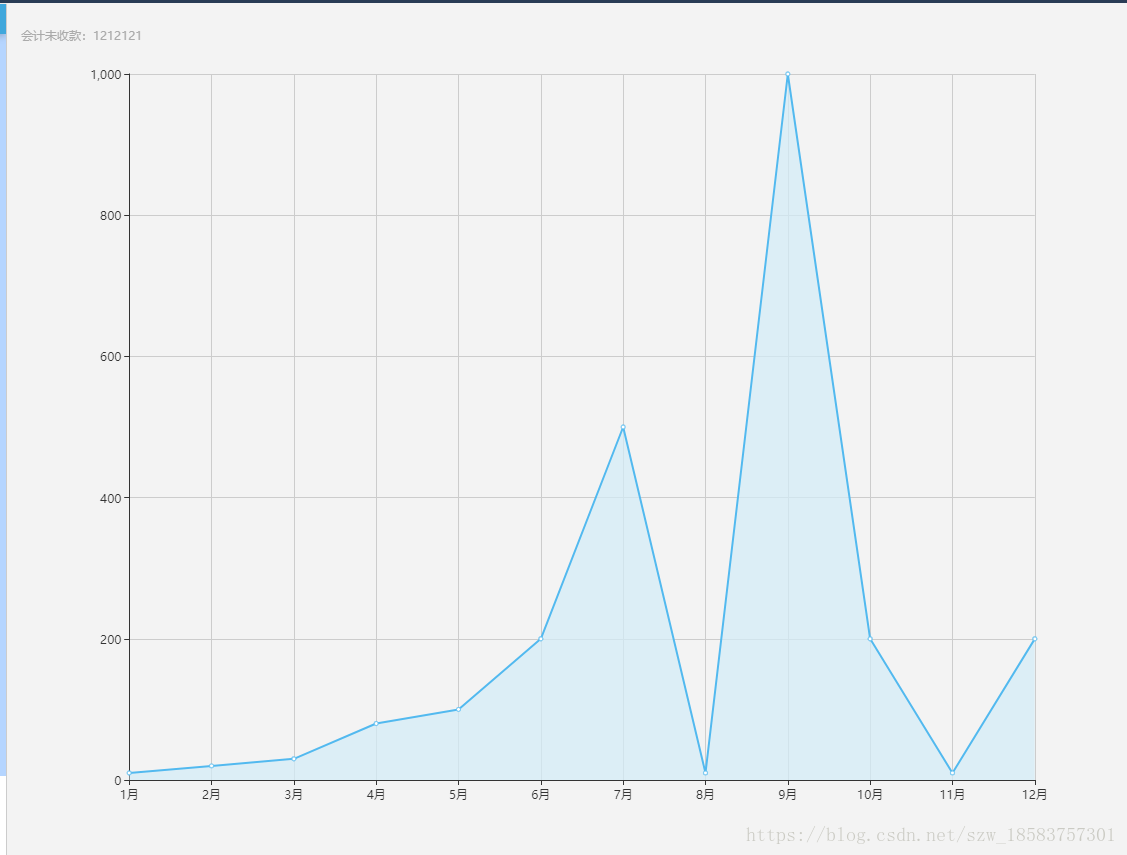
echarts的折线图

option = {

        title: {
          subtext: "会计未收款:" +1212121
        },
        tooltip: {
          trigger: "axis"
        },
        xAxis: {
          type: "category",
          boundaryGap: false,
          splitLine:{show: true},  // 保留网格线 
          data: [
            "1月",
            "2月",
            "3月",
            "4月",
            "5月",
            "6月",
            "7月",
            "8月",
            "9月",
            "10月",
            "11月",
            "12月"
          ]
        },
        yAxis: {
          type: "value",
          axisLabel: {

        },
        },
        series: [
          {
            name: "该月回款量",
            type: "line",
            areaStyle: {  // 区域颜色
                  normal: {
                      color: '#d2ecf8'
                  }
              },
           itemStyle : {
                                normal : {
                                    color:'#52b9ef', // 线条颜色
                                }
                            }, 
            data: ['10','20','30','80','100','200','500','10','1000','200','10','200']
          }
        ]


};

这里写图片描述

猜你喜欢

转载自blog.csdn.net/szw_18583757301/article/details/81067744