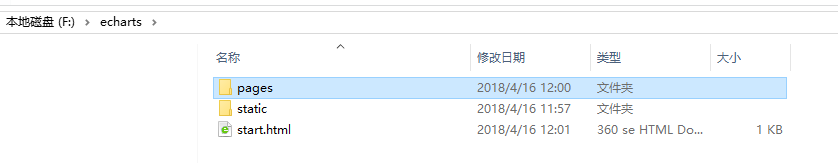
1、工程目录
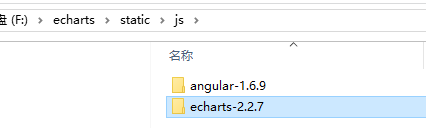
2、引入插件angular-1.6.9、echarts-2.2.7
3、js编辑
var app = angular.module('app', []);
app.controller('lineCtrl', function($scope) {
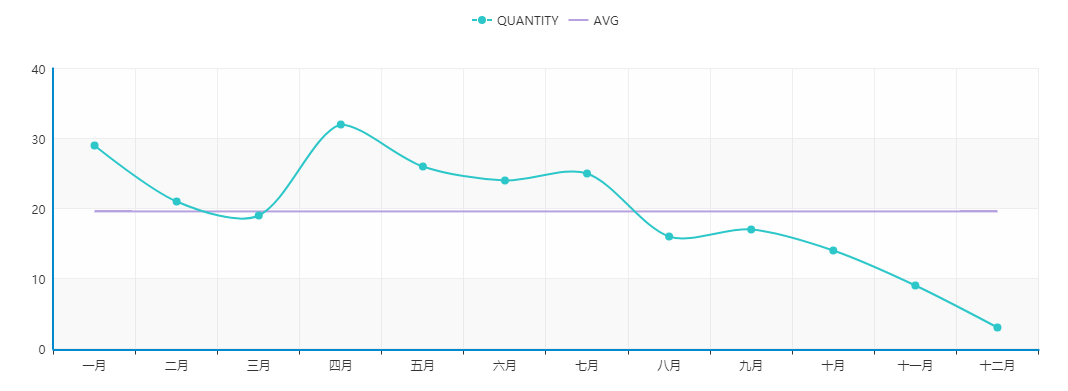
$scope.legend = ['QUANTITY','AVG'];
$scope.item = ['一月', '二月', '三月', '四月', '五月', '六月', '七月', '八月', '九月', '十月', '十一月', '十二月'];
$scope.quantity = [29, 21, 19, 32, 26, 24, 25, 16, 17, 14, 9, 3];
$scope.avg = [];
var total = 0;
for(var i=0;i<$scope.quantity.length;i++){
total += $scope.quantity[i];
}
var v = total/$scope.item.length;
for(var i=0;i<$scope.quantity.length;i++){
$scope.avg.push(v);
}
$scope.data = [
$scope.quantity, //QUANTITY
$scope.avg //AVG
];
});
app.directive('line', function() {
return {
scope: {
id: "@",
legend: "=",
item: "=",
data: "="
},
restrict: 'E',
template: '<div style="height:400px;"></div>',
replace: true,
link: function($scope, element, attrs, controller) {
var option = {
// 提示框,鼠标悬浮交互时的信息提示
tooltip: {
show: true,
trigger: 'item'
},
// 图例
legend: {
data: $scope.legend
},
toolbox: {
feature: {
saveAsImage: {}
}
},
// 横轴坐标轴
xAxis: [{
type: 'category',
data: $scope.item
}],
// 纵轴坐标轴
yAxis: [{
type: 'value'
}],
// 数据内容数组
series: function(){
var serie=[];
for(var i=0;i<$scope.legend.length;i++){
var item = {
name : $scope.legend[i],
type: 'line',
symbol:'', //折点样式
data: $scope.data[i]
};
if($scope.legend[i]=='AVG') {
item.symbol = 'none';
}
serie.push(item);
}
return serie;
}()
};
var myChart = echarts.init(document.getElementById($scope.id),'macarons');
myChart.setOption(option);
}
};
}); // JavaScript Document
4、html编辑
<!DOCTYPE html PUBLIC "-//W3C//DTD XHTML 1.0 Transitional//EN" "http://www.w3.org/TR/xhtml1/DTD/xhtml1-transitional.dtd">
<html xmlns="http://www.w3.org/1999/xhtml">
<head>
<meta http-equiv="Content-Type" content="text/html; charset=utf-8" />
<title>折线图</title>
<!--加载AngularJS-->
<script src="../static/js/angular-1.6.9/angular.js"></script>
<!--加载ECharts-->
<script src="../static/js/echarts-2.2.7/build/dist/echarts-all.js"></script>
<script src="../static/app/lineChartModule.js"></script>
</head>
<body ng-app="app" ng-controller="lineCtrl">
<line id="main" legend="legend" item="item" data="data"></line>
</body>
</html>
5、效果图