import pandas as pd
import numpy as np
data = pd. read_excel( 'fruit_data.xlsx' , index_col= "ID" )
data. head( )
mass
width
height
color_score
fruit_name
ID
1
192
8.4
7.3
0.55
apple
2
180
8.0
6.8
0.59
apple
3
176
7.4
7.2
0.60
apple
4
178
7.1
7.8
0.92
apple
5
172
7.4
7.0
0.89
apple
train_data = data. dropna( )
train_data[ 'category' ] = train_data[ 'fruit_name' ] . apply ( lambda x: 1 if x== 'apple' else 0 )
train_data. head( )
R:\Anaconda\lib\site-packages\ipykernel_launcher.py:2: SettingWithCopyWarning:
A value is trying to be set on a copy of a slice from a DataFrame.
Try using .loc[row_indexer,col_indexer] = value instead

See the caveats in the documentation: https://pandas.pydata.org/pandas-docs/stable/user_guide/indexing.html#returning-a-view-versus-a-copy
mass
width
height
color_score
fruit_name
category
ID
1
192
8.4
7.3
0.55
apple
1
2
180
8.0
6.8
0.59
apple
1
3
176
7.4
7.2
0.60
apple
1
4
178
7.1
7.8
0.92
apple
1
5
172
7.4
7.0
0.89
apple
1
test_data = data. loc[ data[ 'fruit_name' ] . isnull( ) == True ]
test_data
mass
width
height
color_score
fruit_name
ID
39
158
7.1
7.6
0.72
NaN
40
190
7.5
7.9
0.77
NaN
41
189
7.6
7.7
0.77
NaN
42
160
7.9
6.9
0.65
NaN
from sklearn. linear_model import LogisticRegression
X = train_data. iloc[ : , : - 2 ]
y = train_data[ 'category' ]
LR = LogisticRegression( )
LR. fit( X, y)
LogisticRegression(C=1.0, class_weight=None, dual=False, fit_intercept=True,
                   intercept_scaling=1, l1_ratio=None, max_iter=100,
                   multi_class='auto', n_jobs=None, penalty='l2',
                   random_state=None, solver='lbfgs', tol=0.0001, verbose=0,
                   warm_start=False)
print ( LR. intercept_)
[4.54213181]
print ( LR. coef_)
[[-0.01125145 0.97166531 -1.314372 0.20036824]]
test = test_data. iloc[ : , : - 1 ]
print ( LR. predict( test) )
print ( LR. predict_proba( test) )
[0 0 0 1]
[[0.54530945 0.45469055]
 [0.63120971 0.36879029]
 [0.54143416 0.45856584]
 [0.18555923 0.81444077]]
LR. score( X, y)
0.7105263157894737
import statsmodels. api as sm
X1 = sm. add_constant( X)
lr = sm. Logit( y, X1)
result = lr. fit( )
result. summary( )
Optimization terminated successfully.
         Current function value: 0.449106
         Iterations 7
Logit Regression Results
Dep. Variable:
category
No. Observations:
38
Model:
Logit
Df Residuals:
33
Method:
MLE
Df Model:
4
Date:
Tue, 12 May 2020
Pseudo R-squ.:
0.3521
Time:
12:30:14
Log-Likelihood:
-17.066
converged:
True
LL-Null:
-26.340
Covariance Type:
nonrobust
LLR p-value:
0.0009644
coef
std err
z
P>|z|
[0.025
0.975]
const
-7.2016
14.503
-0.497
0.620
-35.627
21.224
mass
-0.0238
0.024
-0.982
0.326
-0.071
0.024
width
4.3068
1.844
2.335
0.020
0.692
7.922
height
-3.7497
1.641
-2.286
0.022
-6.965
-0.534
color_score
9.8913
5.746
1.722
0.085
-1.370
21.152
result. predict( sm. add_constant( test) )
ID
39    0.147665
40    0.194533
41    0.446099
42    0.972809
dtype: float64
from sklearn. discriminant_analysis import LinearDiscriminantAnalysis
lda = LinearDiscriminantAnalysis( )
X_r = lda. fit( X, y)
X_r. coef_
array([[-0.03206332, 4.57480239, -2.87678633, 10.50469726]])
X_r. score( X, y)
0.7631578947368421
X_r. predict( test)
array([0, 0, 0, 1], dtype=int64)
X_r. predict( X)
array([1, 1, 0, 0, 1, 1, 0, 1, 0, 1, 1, 1, 0, 1, 1, 1, 1, 1, 1, 0, 0, 0,
       0, 0, 0, 0, 0, 1, 0, 1, 0, 0, 1, 0, 0, 0, 0, 1], dtype=int64)
data2 = pd. read_excel( 'mul_fruit.xlsx' )
data2. head( )
ID
mass
width
height
color_score
fruit_name
kind
0
1
192
8.4
7.3
0.55
apple
1.0
1
2
180
8.0
6.8
0.59
apple
1.0
2
3
176
7.4
7.2
0.60
apple
1.0
3
4
178
7.1
7.8
0.92
apple
1.0
4
5
172
7.4
7.0
0.89
apple
1.0
train_data2 = data2. dropna( )
test2 = data2. loc[ data2[ 'fruit_name' ] . isnull( ) == True ] . iloc[ : , 1 : 5 ]
target_names = train_data2[ 'fruit_name' ] . unique( )
X = train_data2. iloc[ : , [ 1 , 2 , 3 , 4 ] ]
y = train_data2[ 'kind' ]
lda2 = LinearDiscriminantAnalysis( n_components= 2 )
X_r2 = lda. fit( X, y)
X_r2. score( X, y)
0.8305084745762712
X_r2. predict( test2)
array([3., 3., 3., 1., 2., 4., 1., 3.])
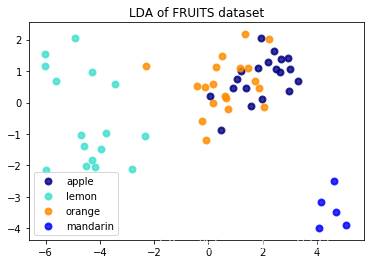
import matplotlib. pyplot as plt
X_rr = X_r2 = lda. fit( X, y) . transform( X)
plt. figure( )
colors = [ 'navy' , 'turquoise' , 'darkorange' , 'blue' ]
lw = 2
for color, i, target_name in zip ( colors, [ 1 , 2 , 3 , 4 ] , target_names) :
plt. scatter( X_rr[ y == i, 0 ] , X_rr[ y == i, 1 ] , color= color, alpha= .8 , lw= lw,
label= target_name)
plt. legend( loc= 'best' , shadow= False , scatterpoints= 1 )
plt. title( 'LDA of FRUITS dataset' )
Text(0.5, 1.0, 'LDA of FRUITS dataset')
np. set_printoptions( suppress= True )