import requests
import pandas as pd
from matplotlib import pyplot as plt
from lxml import etree
url = 'http://www.tianqihoubao.com/lishi/changping/month/201911.html'
headers = {
'User-Agent': 'Mozilla/5.0 (Windows NT 10.0; Win64; x64) AppleWebKit/537.36 (KHTML, like Gecko) Chrome/78.0.3904.97 Safari/537.36'
}
dates,conditions,tem = [],[],[]
response = requests.get(url,headers=headers).text
tree = etree.HTML(response)
tr_list = tree.xpath('//*[@id="content"]/table//tr')
for tr in tr_list[1:]:
date = tr.xpath('./td[1]/a/text()')[0].replace('\r\n','').strip()
condition = tr.xpath('./td[2]/text()')[0].replace('\r\n ','').strip()
temp = tr.xpath('./td[3]/text()')[0].replace('\r\n ','').strip()
dates.append(date)
conditions.append(condition)
tem.append(temp)
_date = pd.DataFrame()
_date['日期'] = dates
_date['天气状况'] = conditions
_date['气温'] = tem
# 重写索引()
pd.concat([_date,]).reset_index(drop=True)
data = pd.concat([_date,])
data.to_csv('changping.csv',index=False,encoding='utf-8')
# 数据可视化
# 解决中文编码问题
plt.rcParams['font.sans-serif'] = ['SimHei']
# 解决负号显示问题
plt.rcParams['axes.unicode_minus'] = False
df = pd.read_csv('guangzhou.csv')
# print((df.isnull()).sum())#检查是否有空值,并求出数量
# 日期 0
# 天气状况 0
# 气温 0
# dtype: int64
df['最高气温'] = df['气温'].str.split('/',expand=True)[0]
df['最低气温'] = df['气温'].str.split('/',expand=True)[1]
df['最高气温'] = df['最高气温'].map(lambda x:int(x.replace('℃','')))
df['最低气温'] = df['最低气温'].map(lambda x:int(x.replace('℃','')))
dates = df['日期']
tem_hight = df['最高气温']
tem_low = df['最低气温']
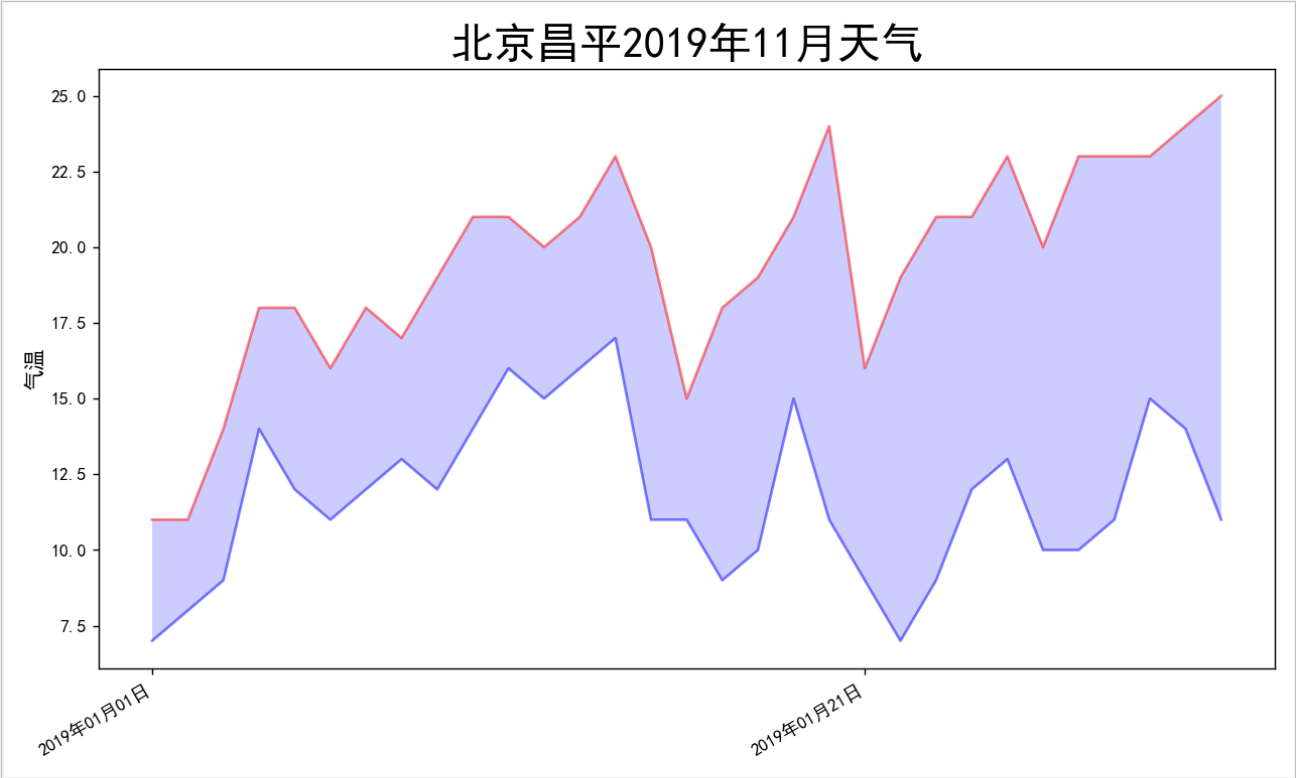
flg = plt.figure(dpi=128,figsize=(10,6)) #展示生成的图大大小
plt.plot(dates, tem_hight, c='red', alpha=0.5)#c='red',:颜色 alpha=0.5:透明底
plt.plot(dates, tem_low, c='blue', alpha=0.5)
plt.fill_between(dates,tem_hight,tem_low,facecolor='blue',alpha=0.2)
# 图标格式
plt.title('北京昌平2019年11月天气',fontsize=24) #标题
plt.xlabel('日期',fontsize=6) #横坐标标题以及字体大小
flg.autofmt_xdate()
plt.ylabel('气温',fontsize=12) #纵坐标标题以及字体大小
plt.tick_params(axis='both',which='major',labelsize=10)
plt.xticks(dates[::20])
plt.show()