1.问题的提出:
实践通过BeautifulSoup爬取实时网络数据,在Python3+PyQt5的环境下展现数据,用PyQtChart实现可视化。
2.Python模块要求及安装方法:(我的环境为python3.7)
1)Python3.7下安装BeautifulSoup4
pip install lxml -i https://mirrors.aliyun.com/pypi/simple
pip install html5lib -i https://mirrors.aliyun.com/pypi/simple
2)Python3.7下安装
pip install pyqtchart -i https://mirrors.aliyun.com/pypi/simple
3.解决问题思路:
1)爬取网上实时天气数据
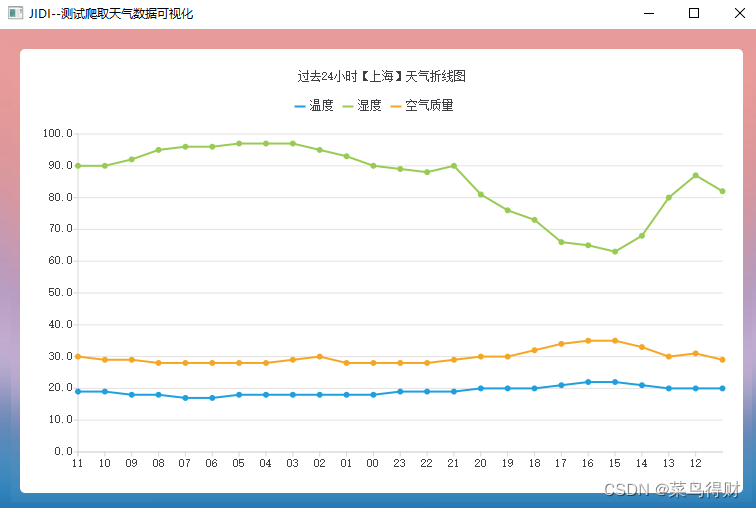
2)将数据通过折线图的方式显示过去24小时城市天气情况(包括温度,湿度,空气质量)
4.代码实现
1)实现过去24小时天气数据的采集
    def getUrlContent(self,url, headers):
        response = requests.get(url, headers)
        text = response.content.decode("utf-8")
        bs = BeautifulSoup(text, "html.parser")
        body = bs.body
        return body

    def getDay24Data(self,soup):
        data2 = soup.find_all('div', {'class': 'left-div'})
        text = data2[2].find('script').string
        text = text[text.index('=') + 1:-2]  # 移除改var data=将其变为json数据
        jd = json.loads(text)
        address = jd['od']['od1']  # 城市
        print(address)
        dayone = jd['od']['od2']  # 找到当天的数据
        tempC = []  # X轴标题
        tempT = []  # 温度
        tempH = []  # humidity相对湿度
        tempA = []  # air空气质量
        for i in dayone:
            tempC.append(i['od21'])  # 添加时间
            tempT.append(int(i['od22']))  # 添加当前时刻温度
            tempH.append(int(i['od27']))  # 添加当前时刻相对湿度
            if len(i['od28']) == 0:
                i['od28'] = '0'
            tempA.append(int(i['od28']))  # 添加当前时刻空气质量  # print(temp)
        final_day = {"城市": address, "C": tempC, "T": tempT, "H": tempH, "A": tempA}
        return final_day
调用获取数据:
self.domain = "http://www.weather.com.cn/weather/101020100.shtml"
        self.headers = {
            'User-Agent': 'Mozilla/5.0 (Windows NT 10.0; WOW64; rv:61.0) Gecko/20100101 Firefox/61.0'}  # 自定义header
        self.soup = self.getUrlContent(self.domain, self.headers)
        self.day24 = self.get_content(self.soup)
2)折线图类实现:
class LineSerChartView(QChartView):

    def __init__(self, *args, **kwargs):
        super(LineSerChartView, self).__init__(*args, **kwargs)
        # self.resize(800, 600)
        self.setRenderHint(QPainter.Antialiasing)  # 抗锯齿

    def initData(self,category,datatable):
        self.category = category
        self.dataTable = datatable
    def initChart(self,title='折线图叠加'):
        self._chart = QChart(title=title)
        self._chart.setAcceptHoverEvents(True)
        # Series动画
        self._chart.setAnimationOptions(QChart.SeriesAnimations)

        for series_name, data_list in self.dataTable:
            series = QLineSeries(self._chart)
            for j, v in enumerate(data_list):
                series.append(j, v)
            series.setName(series_name)
            series.setPointsVisible(True)  # 显示圆点
            #gtj
            # series.hovered.connect(self.handleSeriesHoverd)  # 鼠标悬停
            self._chart.addSeries(series)
        self._chart.createDefaultAxes()  # 创建默认的轴
        axisX = self._chart.axisX()  # x轴
        axisX.setTickCount(24)  # x轴设置24个刻度
        axisX.setGridLineVisible(False)  # 隐藏从x轴往上的线条
        axisY = self._chart.axisY()
        axisY.setTickCount(11)  # y轴设置11个刻度
        axisY.setRange(0, 100)  # 设置y轴范围
        # 自定义x轴
        axis_x = QCategoryAxis(
            self._chart, labelsPosition=QCategoryAxis.AxisLabelsPositionOnValue)
        axis_x.setTickCount(24)
        axis_x.setGridLineVisible(False)
        min_x = axisX.min()
        max_x = axisX.max()
        step = 1
        for i in range(0, 24):
            axis_x.append(self.category[i], min_x + i * step)
        self._chart.setAxisX(axis_x, self._chart.series()[-1])
        # chart的图例
        legend = self._chart.legend()
        # 设置图例由Series来决定样式
        legend.setMarkerShape(QLegend.MarkerShapeFromSeries)

        self.setChart(self._chart)
3)最后调用图表在窗口展示
from LineSerChartView import LineSerChartView

class MainDo(QWidget, Ui_MainWin):
    def __init__(self):
        QWidget.__init__(self)
        Ui_MainWin.__init__(self)

        self.initUi()

        self.initData()

        chartView =LineSerChartView()
        chartView.initData(self.category, self.dataTable)
        chartView.initChart("过去24小时【%s】天气折线图"%self.day24["城市"])
        chartView.show()

        mainLayout = QGridLayout()
        mainLayout.addWidget(chartView, 1, 0)

        self.setLayout(mainLayout)

    def initUi(self):
        self.setupUi(self)
        self.setWindowTitle("JIDI--测试爬取天气数据可视化")
        self.setAutoFillBackground(True)

        self.palette = QPalette()
        self.palette.setBrush(QPalette.Background, QBrush(QPixmap("./bg.png").scaled(    # 缩放背景图.
                self.size(),Qt.IgnoreAspectRatio,Qt.SmoothTransformation)))
        self.setPalette(self.palette)

    def initData(self):
        self.domain = "http://www.weather.com.cn/weather/101020100.shtml"
        self.headers = {
            'User-Agent': 'Mozilla/5.0 (Windows NT 10.0; WOW64; rv:61.0) Gecko/20100101 Firefox/61.0'}  # 自定义header
        self.soup = self.getUrlContent(self.domain, self.headers)
        self.day24 = self.getDay24Data(self.soup)

        self.category = self.day24["C"]
        self.dataTable = [["温度", self.day24["T"]],
                          ["湿度", self.day24["H"]],
                          ["空气质量", self.day24["A"]]
                          ]