版权声明:来自 https://blog.csdn.net/Leesoar521yt/article/details/81482742
上篇我爬取了淘宝宝贝数据(Selemium实战:爬取淘宝页面数据),现在使用pyecharts将数据可视化。当然,首先不要忘了下载pyecharts:
pip install pyecharts开始pyecharts的数据可视化之旅吧!
首先来了解一哈 pyecharts都有什么图吧:
- Bar(柱状图/条形图)
- Bar3D(3D 柱状图)
- Boxplot(箱形图)
- EffectScatter(带有涟漪特效动画的散点图)
- Funnel(漏斗图)
- Gauge(仪表盘)
- Geo(地理坐标系)
- GeoLines(地理坐标系线图)
- Graph(关系图)
- HeatMap(热力图)
- Kline/Candlestick(K线图)
- Line(折线/面积图)
- Line3D(3D 折线图)
- Liquid(水球图)
- Map(地图)
- Parallel(平行坐标系)
- Pie(饼图)
- Polar(极坐标系)
- Radar(雷达图)
- Sankey(桑基图)
- Scatter(散点图)
- Scatter3D(3D 散点图)
- ThemeRiver(主题河流图)
- TreeMap(矩形树图)
- WordCloud(词云图)
首先将爬取的淘宝数据导入到代码中:
from json import loads
from pyecharts import Geo, Map, WordCloud

with open('./taobao.json', 'r') as f:
    product_list = loads(f.read())
用地理坐标系(Geo)绘制散点图显示全国iPad商铺所在城市分布:
def location(product_list):   # 城市
    for i in range(len(product_list)):
        try:
            yield product_list[i]['位置'].split(' ')[1]
        except Exception:
            pass

location_dict = {}      # 商铺位置字典({"location": "count"})
for sub in location(product_list):
    if sub not in location_dict:
        location_dict[sub] = 1
    else:
        location_dict[sub] += 1

location_list = []      # 商铺位置列表(省份名)
for key in location_dict.keys():
    location_list.append((key, location_dict[key]))

geo = Geo("淘宝iPad商铺分布图", "data from taobao.com", title_color="#fff",
          title_pos="center", width=1300,
          height=650, background_color='#404a59')
attr, value = geo.cast(location_list)
geo.add("", attr, value, visual_range=[0, 300], visual_text_color="#fff",
        symbol_size=15, is_visualmap=True)
geo.render()
使用地图(Map)绘制iPad所在省份分布图:
def location(product_list):   # 省份
    for i in range(len(product_list)):
        yield product_list[i]['位置'].split(' ')[0]

location_dict = {}      # 商铺位置字典({"location": "count"})
for sub in location(product_list):
    if sub not in location_dict:
        location_dict[sub] = 1
    else:
        location_dict[sub] += 1
value = list(location_dict.values())
attr = list(location_dict.keys())
map = Map("全国淘宝iPad商铺分布图", "data from taobao.com", title_pos="center", width=1200, height=600)
map.add("", attr, value, maptype='china', is_visualmap=True, visual_text_color='#000')
map.render()
使用WordCloud(pyecharts自带的,非wordcloud包中的WordCloud)绘制省份词云图:

效果太丑,万不得已还是不要用pyecharts的WordCloud做词云 = =。
name = list(location_dict.keys())
value = list(location_dict.values())
wordcloud = WordCloud(width=1300, height=620)
wordcloud.add("", name, value, word_size_range=[20, 100], rotate_step=52)
wordcloud.render()
既然提到wordcloud包,那就用wordcloud与jieba来将爬取的商品标题做个词云图。
首先要下载两个包( jieba 用来分词,wordcloud 制作词云图):
pip install wordcloud
pip install jieba
然后先来个基本词云图看下(wordcloud不支持中文,所以在
font_path中需自行设置字体路径):
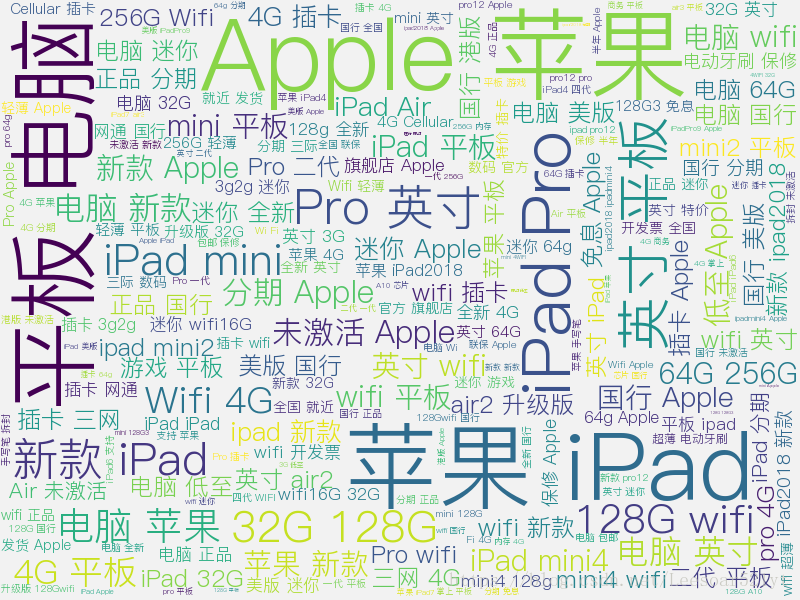
from wordcloud import WordCloud
from json import loads
import jieba


with open('./taobao.json', 'r', encoding='utf-8') as f:
    product_list = loads(f.read())

text = str([product['标题'] for product in product_list]).replace("'", '').replace(',', '').rstrip(']').lstrip('[')   # 爬取的标题文本
cut_text = jieba.cut(text)   # jieba分词
result = '/'.join(cut_text)   # 设置个分隔符来分词,否则词云绘制失败
wc = WordCloud(font_path='./PingFang Regular.ttf', background_color='white', width=800, height=600, max_font_size=100, max_words=5000)#,min_font_size=10)#,mode='RGBA',colormap='pink')
wc.generate(result)
wc.to_file('./cloud.png')   # 储存图片
现在来做个自定义背景的词云图。由于是iPad,那么背景就采用 乔布斯大神 的照片:
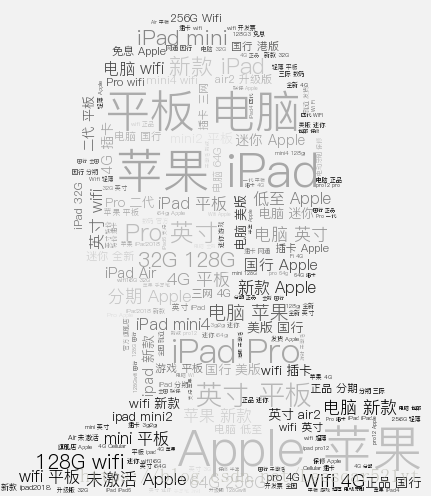
from wordcloud import WordCloud, ImageColorGenerator
from PIL import Image
import numpy as np
from json import loads
import jieba


with open('./taobao.json', 'r', encoding='utf-8') as f:
    product_list = loads(f.read())

text = str([product['标题'] for product in product_list]).replace("'", '').replace(',', '').rstrip(']').lstrip('[')   # 爬取的标题文本
cut_text = jieba.cut(text, cut_all=False)   # jieba分词
result = '/'.join(cut_text)   # 设置个分隔符来分词,否则词云绘制失败
image = Image.open('./apple.jpg')   # 设置背景图
graph = np.array(image)   # 放入numpy的array中
wc = WordCloud(font_path='./PingFang Regular.ttf', background_color='#F2F2F2', max_font_size=100, mask=graph)#,min_font_size=10)#,mode='RGBA',colormap='pink')
wc.generate(result)
image_color = ImageColorGenerator(graph)   # 从背景图片生成颜色值
wc.recolor(color_func=image_color)   # 重新上色
wc.to_file('./new_cloud.png')   # 储存图片