接着上章分析,上一篇博客中,博主通过抓包方式爬取了拉勾网的深圳市数据分析岗位的全部数据信息。今天,利用爬虫数据进行可视化分析。
1、pandas读取CSV文件成DataFrame
import pandas as pd
job_data = pd.read_csv('lagou_jobs_page_all.csv')
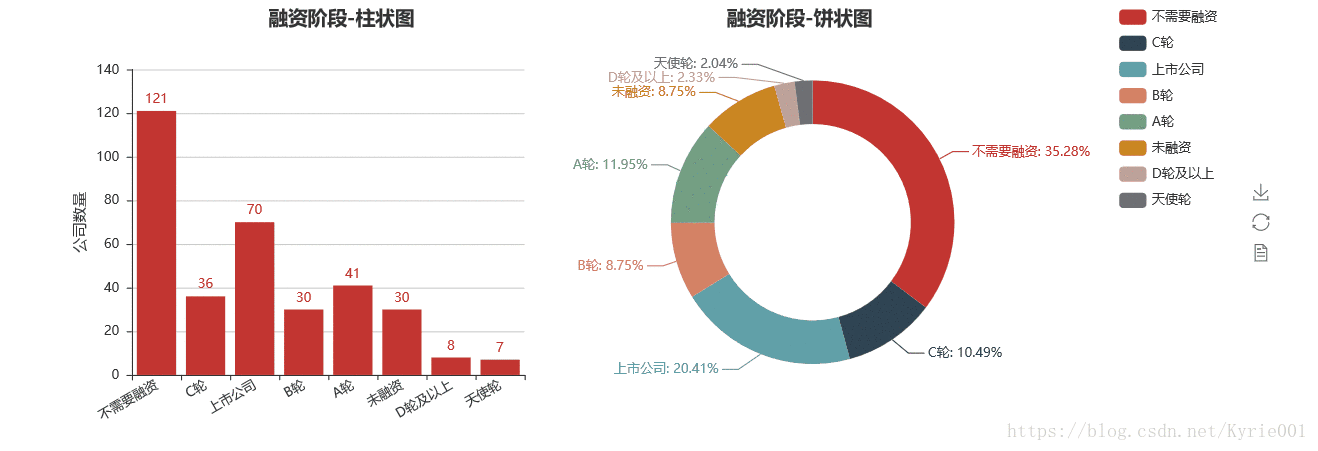
2、公司融资情况
import pandas as pd
from collections import Counter
from pyecharts import Pie,Bar,Grid
job_data = pd.read_csv('lagou_jobs_page_all.csv')
num_financeStage = Counter(job_data["融资阶段"])
finance_stage = list(num_financeStage.keys())
finance_num = list(num_financeStage.values())

bar_financeStage = Bar("融资阶段-柱状图",title_pos='20%')
bar_financeStage.add("",finance_stage,finance_num,yaxis_name="公司数量",yaxis_name_gap=40,xaxis_rotate=30,is_label_show = True)

pie_financeStage = Pie("融资阶段-饼状图",title_pos='55%')
pie_financeStage.add("",finance_stage,finance_num,is_label_show = True,
                     radius=[45, 65],center=[62, 50],legend_orient = "vertical",legend_pos = "85%")
grid = Grid(width=1200)
grid.add(bar_financeStage,grid_right="60%")
grid.add(pie_financeStage,grid_left="60%")
grid.render()
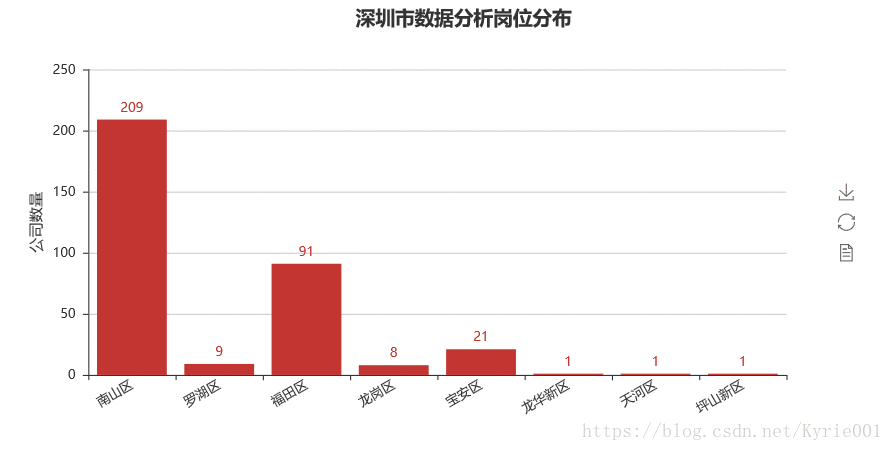
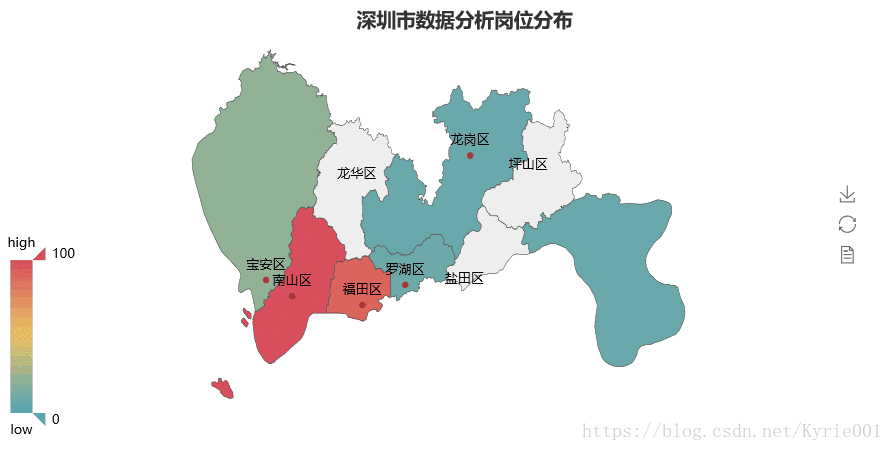
3、工作区域Map图
from pyecharts import Map
job_data_drop = job_data["区域"].dropna()
#去除空值
num_jobarea = Counter(job_data_drop)
job_area = list(num_jobarea.keys())
# print(job_area)
job_num = list(num_jobarea.values())
bar_job_area = Bar("深圳市数据分析岗位分布",title_pos='40%')
bar_job_area.add("",job_area,job_num,yaxis_name="公司数量",yaxis_name_gap=40,xaxis_rotate=30,is_label_show = True)
bar_job_area.render()
map = Map("深圳市数据分析岗位分布",title_pos='40%')
map.add(
    "", job_area, job_num, maptype="深圳", is_label_show=True,is_visualmap=True, visual_text_color="#000"
)
map.render()
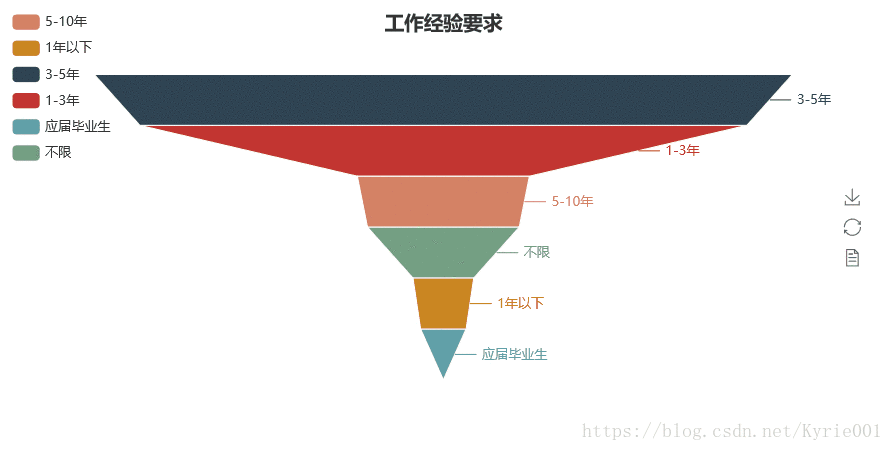
4、工作经验
from pyecharts import Funnel
job_experience = Counter(job_data["工作经验"])
# print(job_experience)
job_experience_attr = list(job_experience.keys())
job_experience_value = list(job_experience.values())
funnel = Funnel("工作经验要求",title_pos = "center")
funnel.add(
    "",
    job_experience_attr,
    job_experience_value,
    is_label_show=True,
    label_pos="outside",
    legend_orient="vertical",
    legend_pos="left",
#     label_text_color="#fff",
)
funnel.render()
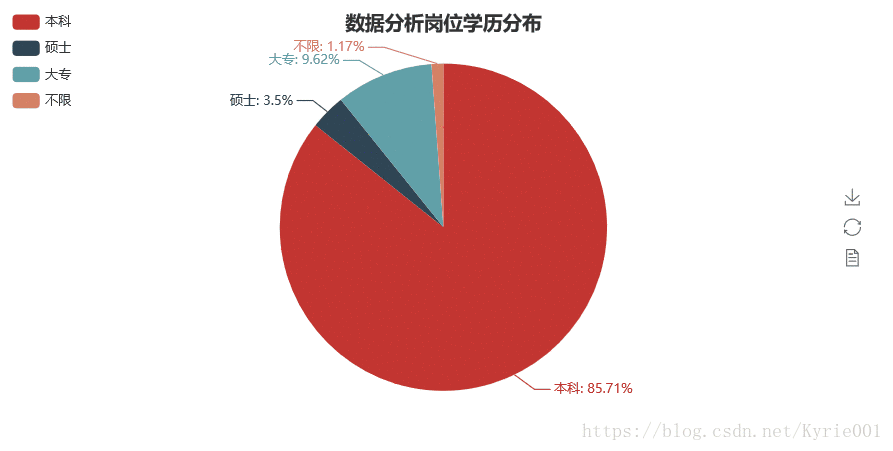
5、学历要求
job_education = Counter(job_data["学历要求"])
job_education_attr = list(job_education.keys())
job_education_value = list(job_education.values())
job_education_pie = Pie("数据分析岗位学历分布",title_pos = "center")
job_education_pie.add("",job_education_attr,job_education_value,is_label_show = True,legend_orient = "vertical",legend_pos = "left")
job_education_pie.render()
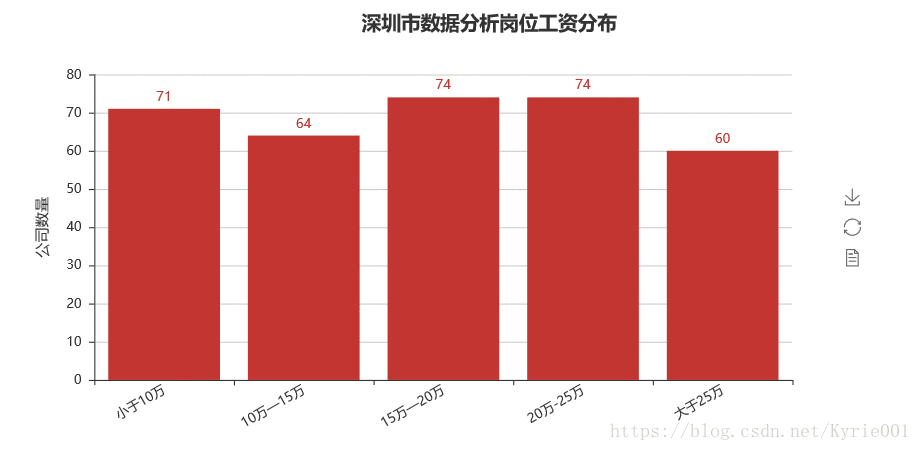
6、工资水平
# job_data['工资']
#将列表字符串合并
str_salary="".join(job_data['工资'])
#print(str_salary)
str_salary_1=str_salary.replace("-","")
# print(str_salary_1)
#最后一个数是空格,所以应该删除掉
list_salary=str_salary_1.lower().split('k')[0:-1]
#正序
# print(list_salary)
#反序
list_salary.reverse()
#print(list_salary)
list_salary_average = []
for i in range(int(len(list_salary)/2)):
    a = int(list_salary.pop())
    b = int(list_salary.pop())
    average = (a+b)/2
    list_salary_average.append(average)
#print(list_salary_average)

num_10,num_10_15,num_15_20,num_25_down,num_25_up = 0,0,0,0,0
for i in list_salary_average:
    #print(i)
    if i < 10:
        num_10 += 1
    elif i<15:
        num_10_15 += 1
    elif i<20:
        num_15_20 +=1
    elif i <25:
        num_25_down+=1
    else:
        num_25_up+=1

list_end = [num_10,num_10_15,num_15_20,num_25_down,num_25_up]
# print(list_end)

from pyecharts import Bar

job_salary_message = ["小于10万","10万—15万","15万—20万","20万-25万","大于25万"]
job_salary_number = list_end[:]

bar_job_area = Bar("深圳市数据分析岗位工资分布",title_pos='40%')
bar_job_area.add("",job_salary_message,job_salary_number,yaxis_name="公司数量",yaxis_name_gap=40,xaxis_rotate=30,is_label_show = True)
bar_job_area.render()
7、公司规模
from pyecharts import Radar
job_scale = Counter(job_data["公司规模"])
job_scale_attr = list(job_scale.keys())
print(job_scale_attr)
job_scale_value = list(job_scale.values())
job_scale_value_2 = []
job_scale_value_2.append(job_scale_value)
print(job_scale_value_2)
schema = [('2000人以上',150), ('500-2000人',150), ('150-500人',150), ('50-150人',150), ('15-50人',150), ('少于15人',150)]
radar = Radar()
radar.config(schema)
radar.add("公司规模", job_scale_value_2, label_color=["#4e79a7"], is_area_show=True)
radar.render()

8、职位福利
job_advantage = list(job_data["职位福利"])
#Python 将列表数据写入txt文件
def text_save(filename, data):#filename为写入txt文件的路径,data为要写入数据列表.
    #with open(filename,'w') as file_object:
    with open(filename,'w',encoding='utf-8') as file_object:
        for i in range(len(data)):
            file_object.write(str(data[i])+"  ")
    print("保存文件成功")

text_save("job_advantage.txt",job_advantage)
##好友个性签名词频词云制作
import jieba
import codecs
#from scipy.misc import imread
from imageio import imread
import os
from os import path
import matplotlib.pyplot as plt
from PIL import Image, ImageDraw, ImageFont
from wordcloud import WordCloud, ImageColorGenerator
#import drawBar

def readDocument():
    '''
    获取文档对象,将文档内容按段落读入,并存入doc中
    '''
    text = open('job_advantage.txt','r',encoding='utf-8').read()

    return text

def segment(doc):
    '''
    用jieba分词对输入文档进行分词,并保存至本地(根据情况可跳过)
    '''
    seg_list = " ".join(jieba.cut(doc, cut_all=False)) #seg_list为str类型

    document_after_segment = open('分词结果_job_advantage.txt', 'w+',encoding='utf-8')
    document_after_segment.write(seg_list)
    document_after_segment.close()

    return seg_list


def wordCount(segment_list):
    '''
        该函数实现词频的统计,并将统计结果存储至本地。
        在制作词云的过程中用不到,主要是在画词频统计图时用到。
    '''
    word_lst = []
    word_dict = {}
    with open('词频统计(去停用词)_job_advantage.txt','w',encoding='utf-8') as wf2:
        word_lst.append(segment_list.split(' '))
        for item in word_lst:
            for item2 in item:
                if item2 not in word_dict:
                    word_dict[item2] = 1
                else:
                    word_dict[item2] += 1

        word_dict_sorted = dict(sorted(word_dict.items(), \
        key = lambda item:item[1], reverse=True))#按照词频从大到小排序
        for key in word_dict_sorted:
            wf2.write(key+' '+str(word_dict_sorted[key])+'\n')
    wf2.close()

def drawWordCloud(seg_list):
    '''
        制作词云
        设置词云参数
    '''
    color_mask = imread("heart.jpg") # 读取背景图片,注意路径
    wc = WordCloud(
        #设置字体,不指定就会出现乱码,注意字体路径
        font_path="simkai.ttf",
        #font_path=path.join(d,'simsun.ttc'),
        #设置背景色
        background_color='white',
        #词云形状
        mask=color_mask,
        #允许最大词汇
        max_words=2000,
        #最大号字体
        max_font_size=70,
        min_font_size=10
    )
    wc.generate(seg_list) # 产生词云
    image_colors = ImageColorGenerator(color_mask)

    #  显示词云图片
    #plt.imshow(wc, interpolation="bilinear")
    #plt.axis('off')

    #这里主要为了实现词云图片按照图片颜色取色
    plt.figure()
    plt.imshow(wc.recolor(color_func=image_colors), interpolation="bilinear")
    plt.axis("off")
    wc.to_file("词云_job_advantage.jpg") #保存图片
    #plt.show()

def removeStopWords(seg_list):
    '''
    自行下载stopwords1893.txt停用词表,该函数实现去停用词
    '''
    wordlist_stopwords_removed = []

    stop_words = open('stopwords1893.txt')
    stop_words_text = stop_words.read()

    stop_words.close()

    stop_words_text_list = stop_words_text.split('\n')
    after_seg_text_list = seg_list.split(' ')

    for word in after_seg_text_list:
        if word not in stop_words_text_list:
            wordlist_stopwords_removed.append(word)

    without_stopwords = open('分词结果(去停用词_job_advantage.txt', 'w',encoding='utf-8')
    without_stopwords.write(' '.join(wordlist_stopwords_removed))
    return ' '.join(wordlist_stopwords_removed)


if __name__ == "__main__":
    doc = readDocument()
    segment_list = segment(doc)
    segment_list_remove_stopwords = removeStopWords(segment_list)
    drawWordCloud(segment_list_remove_stopwords)
    wordCount(segment_list_remove_stopwords)
    #drawBar.drawStatBarh()