模型:人体姿态估计沙漏网络(Stacked hourglass network)
项目地址:https://github.com/bearpaw/pytorch-pose
|--- 几点重要备忘
1、LEEDS_annotations.json文件的生成:
Use https://github.com/bearpaw/pytorch-pose/blob/master/miscs/gen_lsp.m to generate the LEEDS_annotations.json. The mean.pth.tar file will be generated automatically when you train on the LSP dataset for the first time.
一、模型使用_使用自己的数据集
【1】自己的数据的导入。
1、数据读取是使用pytorch的 torch.utils.data.DataLoader()来导入的。
2、数据集的定义是在项目目录: 'pytorch-pose/pose/datasets/' 下 。
3、自己的数据集可以在这个文件夹下创建一个文件:/ Mydataset.py
4、Mydataset.py的定义方式就是使用第三种定义方法。
class Mydataset(data.Dataset):
    def __init__(self, data_path, out_res=256):   # 由于沙漏网络输入要求shape:[batch_size, channel, 256, 256],因此设定out_res=256
        ### 读取数据(伪代码) ###
        self.data= LOAD_DATA(data_path)
        ### 读取数据(伪代码) ###
    def _compute_mean(self):    # compute the mean and std of every pixel in per picture on each channel.
        meanstd_file = '<均值方差数据的存储地址>'
        if isfile(meanstd_file):
            meanstd = torch.load(meanstd_file)
        else:
            mean = torch.zeros(3)   # 图片3通道,计算每个通道图片的像素点均值。
            std = torch.zeros(3)    # 图片3通道,计算每个通道图片的像素点方差。
            ### 循环取出数据(伪代码) ###
            for ind, im_name in [数据集数据]:
                img = load_image(im_name)  # 输出图片shape:CxHxW
            ### 循环取出数据(伪代码)###
                mean += img.view(img.size(0), -1).mean(1)
                std += img.view(img.size(0), -1).std(1)
            mean /= len(self.dic['image_list'])
            std /= len(self.dic['image_list'])
            meanstd = {
                'mean': mean,
                'std': std,
            }
            torch.save(meanstd, meanstd_file)

        return meanstd['mean'], meanstd['std']

    def __getitem__(self, index):
        out_res = 256

        ### 样本提取 ###
        img = self.data[index]  # 选取第index个图片。
        ### 样本提取 ###

        #--- scale生成 ---#
        img_temp = im_to_numpy(img)  # img shape装换成HxWxC

        height, width = float(img_temp.shape[0]), float(img_temp.shape[1])
        # center = torch.Tensor([int(height / 2), int(width / 2)])
        center = torch.Tensor([50, 50])
        scale = min(boxsize / height, boxsize / width)
        # 本段代码参考:https://blog.csdn.net/zziahgf/article/details/72763590
        #--- scale生成 ---#

        #--- 图片统一尺寸 ---#
        inp = normal_resize(img_temp, scale, out_res)   # 下面有定义。
        #--- 图片统一尺寸 ---#

        return img

    def __len__(self):
        return len(self.data1) # 我的例子中len(self.data1) = len(self.data2)

    def normal_resize(img, scale, res):
    # 代码参考:https://blog.csdn.net/zziahgf/article/details/72763590
        import cv2
        # 提取的图片的array形状:(128, 64, 3(R,G,B))
        img_resize = cv2.resize(img, (0, 0), fx=scale, fy=scale, interpolation=cv2.INTER_LANCZOS4)
        h_, w_ = img_resize.shape[0], img_resize.shape[1]
        pad_up = abs(int((res - h_) / 2))
        pad_down = abs(res - h_ - pad_up)
        pad_left = abs(int((res - w_) / 2))
        pad_right = abs(res - w_ - pad_left)

        pad_img = np.lib.pad(img_resize, ((pad_up, pad_down), (pad_left, pad_right), (0, 0)), 'constant', constant_values=0)

        pad_img = np.transpose(pad_img, (2, 0, 1))  # C*H*W
        pad_img = to_torch(pad_img).float()

return pad_img定义完后修改下__init__.py文件:
from .mpii import Mpii
from .mscoco import Mscoco
from .lsp import LSP
### 添加 ###
from .Mydataset import Mydataset
### 添加 ###
__all__ = ('Mpii', 'Mscoco', 'LSP',
           'Mydataset'   ### 添加 ###
           )
5、最后调用数据集输出的图片是这样的:
原图:

# 调用方法:
dataloaders = torch.utils.data.DataLoader(
            datasets.Mydataset(地址),
            batch_size=args.test_batch, shuffle=False,
            num_workers=args.workers, pin_memory=True)
        print('test_loader finished')
【2】模型的使用。
模型使用: 输出
# https://github.com/bearpaw/pytorch-pose/blob/0867835dc33c3740774b4b4e235d6339af3b9f9e/example/mpii.py#L232
score_map = output[-1].data.cpu() # 这个输出是shape[batch_size,16, 64, 64]大小的热图
https://github.com/bearpaw/pytorch-pose/blob/0867835dc33c3740774b4b4e235d6339af3b9f9e/example/mpii.py#L250
preds = final_preds(score_map, meta['center'], meta['scale'], [64, 64]) # 这个是输出16个关节点的坐标。
# 由于我们使用原始数据,没有center和scale,因此要生成坐标采用这种方法:
### 伪代码 ###
热图_resize = 热图.reshape(4*热图.长, 4×热图.宽)
preds = 转换坐标(热图)
### 伪代码 ###【3】可视化。
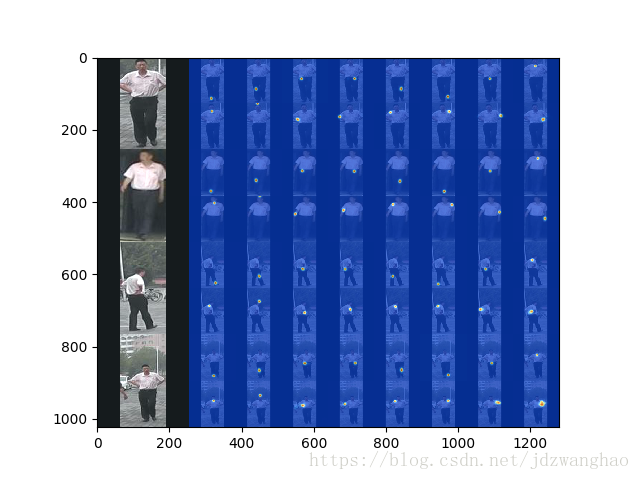
关节点注明:
