1 .导入包
import numpy as np
import matplotlib.pylab as plt
from sklearn import datasets
boston = datasets.load_boston()
boston.keys()dict_keys(['data', 'target', 'feature_names', 'DESCR', 'filename'])
print(boston.DESCR)
2. 获取数据:这里未做数据清洗
x = boston.data
y = boston.target

x.shape   # (506, 13)
y.shape   # (506,)
3. 数据分割
from sklearn.model_selection  import train_test_split

X_train, X_test, y_train, y_test = train_test_split(x,y,test_size=0.2,random_state=666)
from sklearn.linear_model import LinearRegression
reg = LinearRegression()4. 模型训练
reg.fit(X_train, y_train)LinearRegression(copy_X=True, fit_intercept=True, n_jobs=None, normalize=False)
5. 特征参数,也就是模型在每个特征维度上的系数
# 每一个特征对应的参数
reg.coef_
array([-7.56857766e-02,  4.93306230e-02,  6.85902135e-02,  2.55876122e+00,
       -1.60400649e+01,  4.09692993e+00,  6.55718540e-03, -1.41742836e+00,
        2.92373287e-01, -1.41859462e-02, -9.68019957e-01,  1.16809189e-02,
       -5.33536333e-01])
# 截距
reg.intercept_
32.926954792283404
6. 模型准确度评价指标:R的平方
# R Squared(r2 score)
reg.score(X_test, y_test)
0.6336069713055628
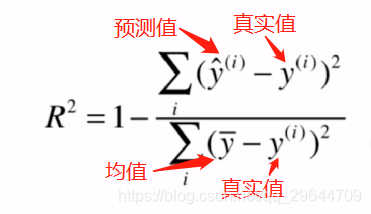
对于 R2_score可以理解为模型拟合特性的占比,以基准(均值)误差为参考。
- R2_score = 1,预测值和真实值完全相等,没有任何误差;
- R2_score = 0。此时分子等于分母,模型和基准模型相同;
- R2_score<0,瞎搞的模型,还不如平均值基准模型的预测,此时数据不存在任何线性相关关系。