1. 线性回归VS KNN
| 线性回归算法 | KNN |
|---|---|
| 典型参数学习 | 非参数学习 |
| 只能解决回归问题,但是在很多分类算法中,线性回归是基础(逻辑回归) | 既可以解决分类问题,又可以解决回归问题,但是解决回归问题,准确率没用线性回归算法高 |
| 对数据有假设:假设数据有线性关系 | 没有假设 |
| 对数据有强解释性 | 没有解释性 |
2. 线性回归算法公式
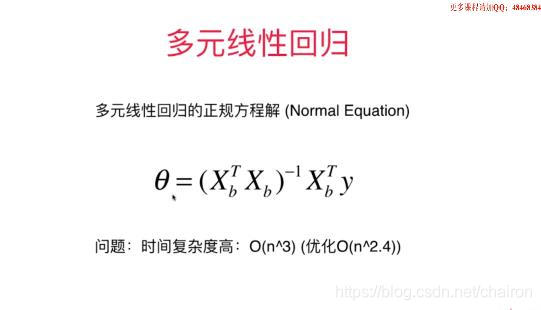
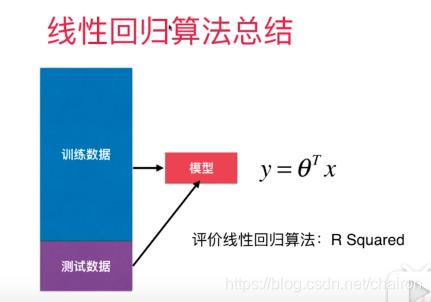
3. 更多关于线性回归模型的讨论
import numpy as np
from sklearn import datasets
boston=datasets.load_boston()
X=boston.data
y=boston.target
X=X[y<50.0]
y=y[y<50.0]
from sklearn.linear_model import LinearRegression
lin_reg=LinearRegression()
lin_reg.fit(X,y)
LinearRegression(copy_X=True, fit_intercept=True, n_jobs=None, normalize=False)
lin_reg.coef_
array([-1.06715912e-01,  3.53133180e-02, -4.38830943e-02,  4.52209315e-01,
       -1.23981083e+01,  3.75945346e+00, -2.36790549e-02, -1.21096549e+00,
        2.51301879e-01, -1.37774382e-02, -8.38180086e-01,  7.85316354e-03,
       -3.50107918e-01])
np.argsort(lin_reg.coef_)
array([ 4, 7, 10, 12, 0, 2, 6, 9, 11, 1, 8, 3, 5], dtype=int64)
boston.feature_names
array(['CRIM', 'ZN', 'INDUS', 'CHAS', 'NOX', 'RM', 'AGE', 'DIS', 'RAD',
       'TAX', 'PTRATIO', 'B', 'LSTAT'], dtype='<U7')
boston.feature_names[np.argsort(lin_reg.coef_)]
array(['NOX', 'DIS', 'PTRATIO', 'LSTAT', 'CRIM', 'INDUS', 'AGE', 'TAX',
       'B', 'ZN', 'RAD', 'CHAS', 'RM'], dtype='<U7')
boston.DESCR
".. _boston_dataset:\n\nBoston house prices dataset\n---------------------------\n\n**Data Set Characteristics:** \n\n :Number of Instances: 506 \n\n :Number of Attributes: 13 numeric/categorical predictive. Median Value (attribute 14) is usually the target.\n\n :Attribute Information (in order):\n - CRIM per capita crime rate by town\n - ZN proportion of residential land zoned for lots over 25,000 sq.ft.\n - INDUS proportion of non-retail business acres per town\n - CHAS Charles River dummy variable (= 1 if tract bounds river; 0 otherwise)\n - NOX nitric oxides concentration (parts per 10 million)\n - RM average number of rooms per dwelling\n - AGE proportion of owner-occupied units built prior to 1940\n - DIS weighted distances to five Boston employment centres\n - RAD index of accessibility to radial highways\n - TAX full-value property-tax rate per $10,000\n - PTRATIO pupil-teacher ratio by town\n - B 1000(Bk - 0.63)^2 where Bk is the proportion of blacks by town\n - LSTAT % lower status of the population\n - MEDV Median value of owner-occupied homes in $1000's\n\n :Missing Attribute Values: None\n\n :Creator: Harrison, D. and Rubinfeld, D.L.\n\nThis is a copy of UCI ML housing dataset.\nhttps://archive.ics.uci.edu/ml/machine-learning-databases/housing/\n\n\nThis dataset was taken from the StatLib library which is maintained at Carnegie Mellon University.\n\nThe Boston house-price data of Harrison, D. and Rubinfeld, D.L. 'Hedonic\nprices and the demand for clean air', J. Environ. Economics & Management,\nvol.5, 81-102, 1978. Used in Belsley, Kuh & Welsch, 'Regression diagnostics\n...', Wiley, 1980. N.B. Various transformations are used in the table on\npages 244-261 of the latter.\n\nThe Boston house-price data has been used in many machine learning papers that address regression\nproblems. \n \n.. topic:: References\n\n - Belsley, Kuh & Welsch, 'Regression diagnostics: Identifying Influential Data and Sources of Collinearity', Wiley, 1980. 244-261.\n - Quinlan,R. (1993). Combining Instance-Based and Model-Based Learning. In Proceedings on the Tenth International Conference of Machine Learning, 236-243, University of Massachusetts, Amherst. Morgan Kaufmann.\n"