效果图展示:
HTML绘制
<div style="width: 600px;height: 400px"></div>
option配置
var mCharts = echarts.init(document.querySelector('div'))
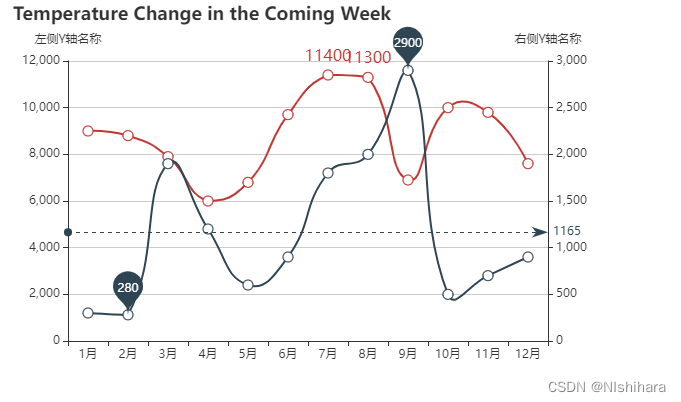
var xDataArr = ['1月', '2月', '3月', '4月', '5月', '6月', '7月', '8月', '9月', '10月', '11月', '12月']
var yDataArr1 = [9000, 8800,7900, 6000, 6800, 9700, 11400, 11300, 6900, 10000, 9800, 7600]
var yDataArr2 = [300, 280, 1900, 1200, 600, 900, 1800, 2000, 2900, 500, 700, 900]
var option = {
title: {
text: 'Temperature Change in the Coming Week'
},
xAxis: {
type: 'category',
data: xDataArr
},
yAxis: [{
name:'左侧Y轴名称',
type: 'value'
},{
name:'右侧Y轴名称',
type: 'value'
}],
series: [
{
yAxisIndex: 0,
data: yDataArr1,
type: 'line',
smooth:true,
symbolSize:10,
label: {
show: true,
position: 'top',
fontSize:16,
formatter:function(params){
if(params.value > 10000){
return params.value
}else{
return ''
}
}
},
},
{
yAxisIndex: 1,
data: yDataArr2,
type: 'line',
smooth:true,
symbolSize:10,
markPoint: {
data: [
{
type: 'max', name: 'Max' },
{
type: 'min', name: 'Min' }
]
},
markLine: {
data: [{
type: 'average', name: 'Avg' }]
}
}
]
}
mCharts.setOption(option)