#主成分分析
import mglearn
import numpy as np
import matplotlib.pyplot as plt
import pandas as pd
from sklearn.datasets import load_breast_cancer
from sklearn.datasets import make_moons
from sklearn.datasets import make_blobs
from sklearn.datasets import make_circles
from sklearn.datasets import load_iris
from sklearn.datasets import fetch_lfw_people
from sklearn.ensemble import RandomForestClassifier
from sklearn.ensemble import GradientBoostingClassifier
from sklearn.svm import LinearSVC
from sklearn.svm import SVC
from sklearn.neighbors import KNeighborsClassifier
from sklearn.decomposition import PCA
from sklearn.linear_model import LogisticRegression
from sklearn.model_selection import train_test_split
from sklearn.tree import DecisionTreeClassifier
from sklearn.neural_network import MLPClassifier
from sklearn.preprocessing import MinMaxScaler
from sklearn.preprocessing import StandardScaler
from numpy.core.umath_tests import inner1d
from mpl_toolkits.mplot3d import Axes3D,axes3d
mglearn.plots.plot_pca_illustration()

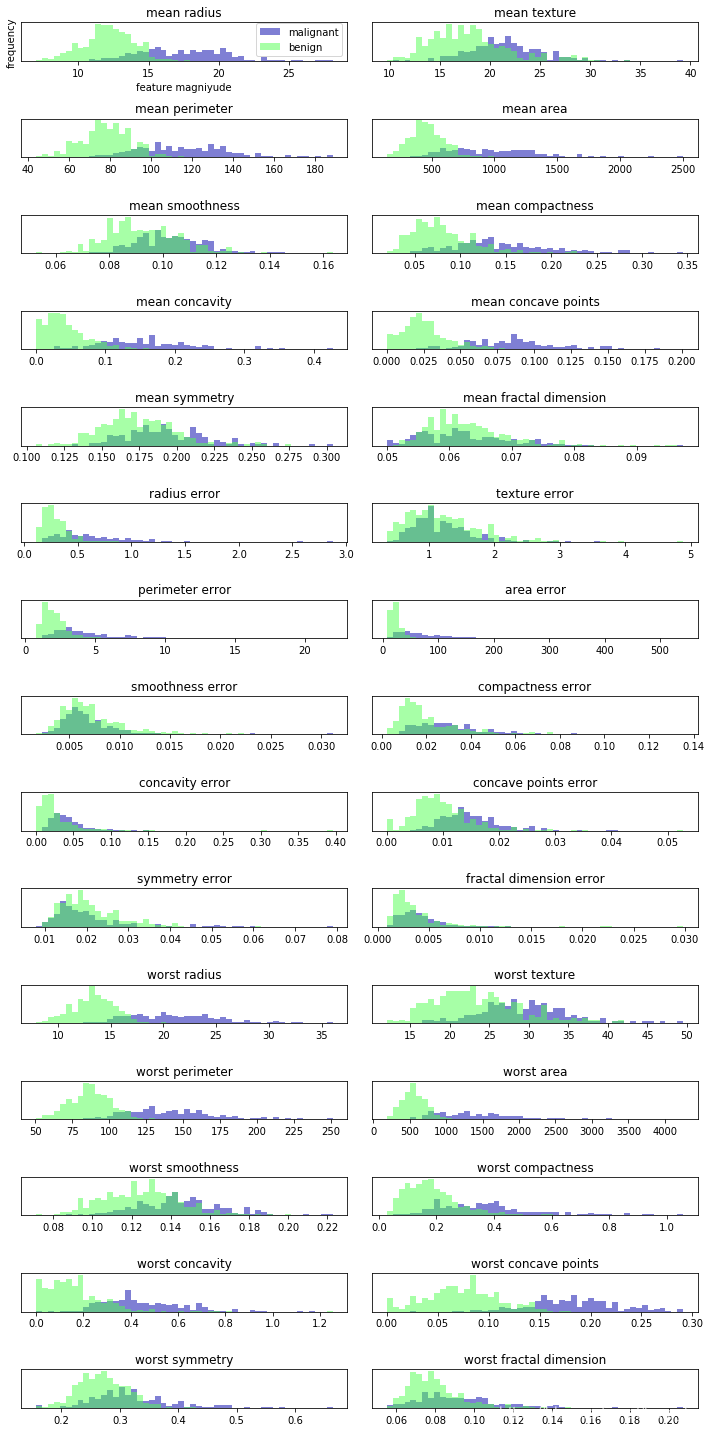
cancer = load_breast_cancer()
fig,axes = plt.subplots(15,2,figsize=(10,20))
malignant = cancer.data[cancer.target == 0]
benign = cancer.data[cancer.target == 1]
ax = axes.ravel()
for i in range(30):
    _,bins = np.histogram(cancer.data[:,i],bins=50)
    ax[i].hist(malignant[:,i],bins=bins,color=mglearn.cm3(0),alpha=.5)
    ax[i].hist(benign[:,i],bins=bins,color=mglearn.cm3(2),alpha=.5)
    ax[i].set_title(cancer.feature_names[i])
    ax[i].set_yticks(())
ax[0].set_xlabel('feature magniyude')
ax[0].set_ylabel('frequency')
ax[0].legend(['malignant','benign'],loc='best')
fig.tight_layout()
scaler = StandardScaler()
scaler.fit(cancer.data)
x_scaled = scaler.transform(cancer.data)
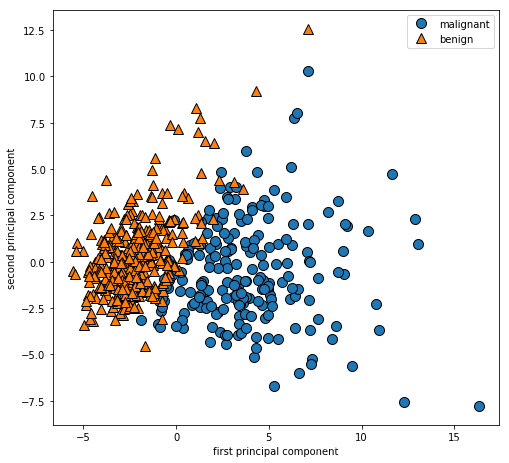
pca = PCA(n_components=2)
pca.fit(x_scaled)
x_pca = pca.transform(x_scaled)
print('original shape:{}'.format(str(x_scaled.shape)))
print('reduced shape:{}'.format(str(x_pca.shape)))
original shape:(569, 30)
reduced shape:(569, 2)
plt.figure(figsize=(8,8))
mglearn.discrete_scatter(x_pca[:,0],x_pca[:,1],cancer.target)
plt.legend(cancer.target_names,loc='best')
plt.gca().set_aspect('equal')
plt.xlabel('first principal component')
plt.ylabel('second principal component')
print("pca components:{}".format(pca.components_.shape))
print("pca components:{}".format(pca.components_))
pca components:(2, 30)
pca components:[[ 0.21890244 0.10372458 0.22753729 0.22099499 0.14258969 0.23928535
0.25840048 0.26085376 0.13816696 0.06436335 0.20597878 0.01742803
0.21132592 0.20286964 0.01453145 0.17039345 0.15358979 0.1834174
0.04249842 0.10256832 0.22799663 0.10446933 0.23663968 0.22487053
0.12795256 0.21009588 0.22876753 0.25088597 0.12290456 0.13178394]
[-0.23385713 -0.05970609 -0.21518136 -0.23107671 0.18611302 0.15189161
0.06016536 -0.0347675 0.19034877 0.36657547 -0.10555215 0.08997968
-0.08945723 -0.15229263 0.20443045 0.2327159 0.19720728 0.13032156
0.183848 0.28009203 -0.21986638 -0.0454673 -0.19987843 -0.21935186
0.17230435 0.14359317 0.09796411 -0.00825724 0.14188335 0.27533947]]
plt.matshow(pca.components_,cmap='viridis')
plt.yticks([0,1],['first component','second comonpent'])
plt.colorbar()
plt.xticks(range(len(cancer.feature_names)),cancer.feature_names,rotation=60,ha='left')
plt.xlabel('feature')
plt.ylabel('principal components')

people = fetch_lfw_people(min_faces_per_person=20,resize=0.7) #灰度图像,按最小比例缩小以加快处理速度
image_shape = people.images[0].shape
fix,axes = plt.subplots(2,5,figsize=(15,8),subplot_kw={'xticks':(),'yticks':()})
for target,image,ax in zip(people.target,people.images,axes.ravel()):
    ax.imshow(image)
    ax.set_title(people.target_names[target])   #每张像素87*65,数据集一共3023张,属于62个不同的人

print('people.images.shape:{}'.format(people.images.shape))
print('number of classes:{}'.format(len(people.target_names)))
people.images.shape:(3023, 87, 65)
number of classes:62
counts = np.bincount(people.target)  #计算每个目标出现的次数
for i,(count,name) in enumerate(zip(counts,people.target_names)):
    print("{0:25}{1:3}".format(name,count),end='   ')
    if(i+1) % 3 == 0:  #一行打三个
        print()
Alejandro Toledo 39 Alvaro Uribe 35 Amelie Mauresmo 21
Andre Agassi 36 Angelina Jolie 20 Ariel Sharon 77
Arnold Schwarzenegger 42 Atal Bihari Vajpayee 24 Bill Clinton 29
Carlos Menem 21 Colin Powell 236 David Beckham 31
Donald Rumsfeld 121 George Robertson 22 George W Bush 530
Gerhard Schroeder 109 Gloria Macapagal Arroyo 44 Gray Davis 26
Guillermo Coria 30 Hamid Karzai 22 Hans Blix 39
Hugo Chavez 71 Igor Ivanov 20 Jack Straw 28
Jacques Chirac 52 Jean Chretien 55 Jennifer Aniston 21
Jennifer Capriati 42 Jennifer Lopez 21 Jeremy Greenstock 24
Jiang Zemin 20 John Ashcroft 53 John Negroponte 31
Jose Maria Aznar 23 Juan Carlos Ferrero 28 Junichiro Koizumi 60
Kofi Annan 32 Laura Bush 41 Lindsay Davenport 22
Lleyton Hewitt 41 Luiz Inacio Lula da Silva 48 Mahmoud Abbas 29
Megawati Sukarnoputri 33 Michael Bloomberg 20 Naomi Watts 22
Nestor Kirchner 37 Paul Bremer 20 Pete Sampras 22
Recep Tayyip Erdogan 30 Ricardo Lagos 27 Roh Moo-hyun 32
Rudolph Giuliani 26 Saddam Hussein 23 Serena Williams 52
Silvio Berlusconi 33 Tiger Woods 23 Tom Daschle 25
Tom Ridge 33 Tony Blair 144 Vicente Fox 32
Vladimir Putin 49 Winona Ryder 24
mask = np.zeros(people.target.shape,dtype=np.bool)
for target in np.unique(people.target):
    mask[np.where(people.target == target)[0][:50]] = 1  #每个人只取50张照片
x_people = people.data[mask]
y_people = people.target[mask]
x_people = x_people / 255  #将灰度值稳定在0~1之间,而不是0~255之间
x_train,x_test,y_train,y_test = train_test_split(x_people,y_people,stratify=y_people,random_state=0)
knn = KNeighborsClassifier(n_neighbors=1)
knn.fit(x_train,y_train)
print("test set score of i-nn:{:.2f}".format(knn.score(x_test,y_test)))
mglearn.plots.plot_pca_whitening()   #pca的白化,相当于standardscaler,得到一个均匀的结果,缩放数据使其为圆形而不是椭圆形

print('x_train.shape:{}'.format(x_train.shape))  #一共1547个数据,5655个特征
print('x_train:{}'.format(x_train))
pca = PCA(n_components=100,whiten=True,random_state=0).fit(x_train)  #使用fit找到主成分,使用transform降维
x_train_pca = pca.transform(x_train)
x_test_pca = pca.transform(x_test)
print('x_train_pca.shape:{}'.format(x_train_pca.shape))
print('x_test_pca.shape:{}'.format(x_test_pca.shape))
knn = KNeighborsClassifier(n_neighbors=1)
knn.fit(x_train_pca,y_train)
print("test set score of pca & i-nn:{:.2f}".format(knn.score(x_test_pca,y_test)))
print("pca.component_.shape:{}".format(pca.components_.shape))
x_train.shape:(1547, 5655)
x_train:[[0.53594774 0.55947715 0.5647059 … 0.5294118 0.40392157 0.24313726]
[0.08888888 0.08627451 0.08888888 … 0.38039216 0.43529412 0.4614379 ]
[0.55424833 0.5464052 0.5411765 … 0.84575164 0.8352941 0.793464 ]
…
[0.4627451 0.4379085 0.40261436 … 0.36732024 0.3647059 0.35816994]
[0.14117648 0.20130718 0.18431373 … 0.5673203 0.75032675 0.88366014]
[0.04313726 0.02614379 0.01830065 … 0.56601304 0.5869281 0.59607846]]
x_train_pca.shape:(1547, 100)
x_test_pca.shape:(516, 100)
test set score of pca & i-nn:0.31
pca.component_.shape:(100, 5655)扫描二维码关注公众号,回复: 9718238 查看本文章
fix,axes = plt.subplots(3,5,figsize=(15,12),subplot_kw={'xticks':(),'yticks':()})
for i,(component,ax) in enumerate(zip(pca.components_,axes.ravel())):
    ax.imshow(component.reshape(image_shape),cmap='viridis')
    ax.set_title("{}.component".format((i+1)))

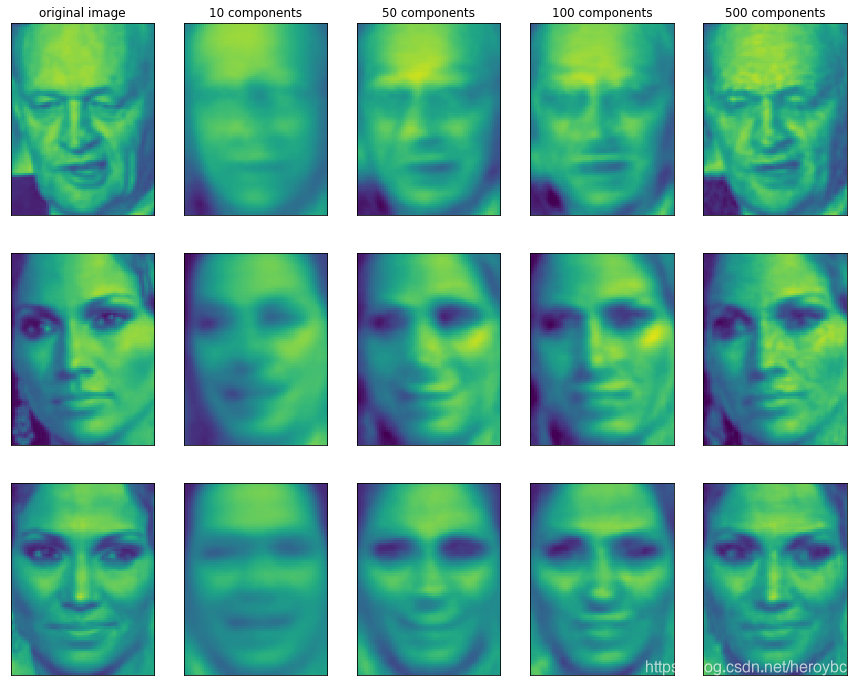
mglearn.plots.plot_pca_faces(x_train,x_test,image_shape)
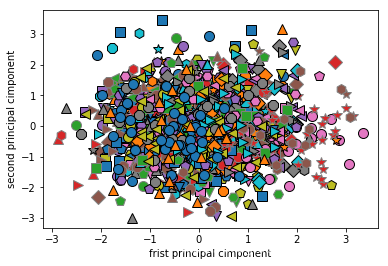
mglearn.discrete_scatter(x_train_pca[:,0],x_train_pca[:,1],y_train)
plt.xlabel("frist principal cimponent")
plt.ylabel("second principal cimponent")