原文地址:http://blog.csdn.net/hjimce/article/details/45718593
作者:hjimce
一、mean shift 算法理论
Mean shift 算法是基于核密度估计的爬山算法,可用于聚类、图像分割、跟踪等,因为最近搞一个项目,涉及到这个算法的图像聚类实现,因此这里做下笔记。
(1)均值漂移的基本形式
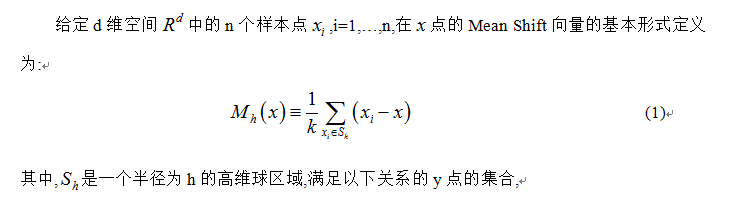
给定d维空间的n个数据点集X,那么对于空间中的任意点x的mean shift向量基本形式可以表示为:
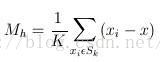
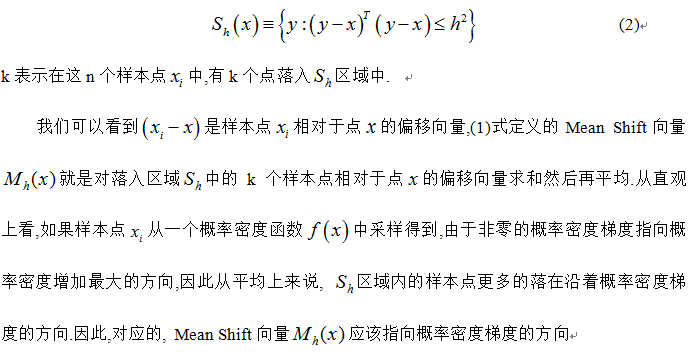
这个向量就是漂移向量,其中Sk表示的是数据集的点到x的距离小于球半径h的数据点。也就是:
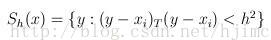

而漂移的过程,说的简单一点,就是通过计算得漂移向量,然后把球圆心x的位置更新一下,更新公式为:

使得圆心的位置一直处于力的平衡位置。
总结为一句话就是:求解一个向量,使得圆心一直往数据集密度最大的方向移动。说的再简单一点,就是每次迭代的时候,都是找到圆里面点的平均位置作为新的圆心位置。
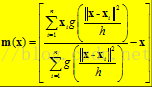
(2)加入核函数的漂移向量
这个说的简单一点就是加入一个高斯权重,最后的漂移向量计算公式为:
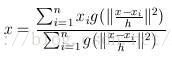
因此每次更新的圆心坐标为:
不过我觉得如果用高斯核函数,把这个算法称为均值漂移有点不合理,既然叫均值漂移,那么均值应该指的是权重相等,也就是(1)中的公式才能称之为真正的均值漂移。
我的简单理解mean shift算法是:物理学上力的合成与物体的运动。每次迭代通过求取力的合成向量,然后让圆心沿着力的合成方向,移动到新的平衡位置。
二、mean shift 聚类流程:
假设在一个多维空间中有很多数据点需要进行聚类,Mean Shift的过程如下:
1、在未被标记的数据点中随机选择一个点作为中心center;
2、找出离center距离在bandwidth之内的所有点,记做集合M,认为这些点属于簇c。同时,把这些求内点属于这个类的概率加1,这个参数将用于最后步骤的分类
3、以center为中心点,计算从center开始到集合M中每个元素的向量,将这些向量相加,得到向量shift。
4、center = center+shift。即center沿着shift的方向移动,移动距离是||shift||。
5、重复步骤2、3、4,直到shift的大小很小(就是迭代到收敛),记住此时的center。注意,这个迭代过程中遇到的点都应该归类到簇c。
6、如果收敛时当前簇c的center与其它已经存在的簇c2中心的距离小于阈值,那么把c2和c合并。否则,把c作为新的聚类,增加1类。
6、重复1、2、3、4、5直到所有的点都被标记访问。
7、分类:根据每个类,对每个点的访问频率,取访问频率最大的那个类,作为当前点集的所属类。
简单的说,mean shift就是沿着密度上升的方向寻找同属一个簇的数据点。
三、mean shift 聚类实现
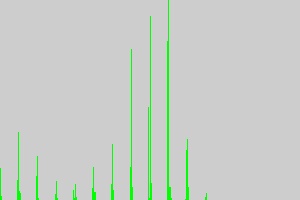
Mean shift 算法不需要指定聚类个数,贴一下用matlab实现的聚类结果:
- clc
- close all;
- clear
- profile on
- %生成随机数据点集
- nPtsPerClust = 250;
- nClust = 3;
- totalNumPts = nPtsPerClust*nClust;
- m(:,1) = [1 1]';
- m(:,2) = [-1 -1]';
- m(:,3) = [1 -1]';
- var = .6;
- bandwidth = .75;
- clustMed = [];
- x = var*randn(2,nPtsPerClust*nClust);
- for i = 1:nClust
- x(:,1+(i-1)*nPtsPerClust:(i)*nPtsPerClust) = x(:,1+(i-1)*nPtsPerClust:(i)*nPtsPerClust) + repmat(m(:,i),1,nPtsPerClust);
- end
- data=x';
- % plot(data(:,1),data(:,2),'.')
- %mean shift 算法
- [m,n]=size(data);
- index=1:m;
- radius=0.75;
- stopthresh=1e-3*radius;
- visitflag=zeros(m,1);%标记是否被访问
- count=[];
- clustern=0;
- clustercenter=[];
- hold on;
- while length(index)>0
- cn=ceil((length(index)-1e-6)*rand);%随机选择一个未被标记的点,作为圆心,进行均值漂移迭代
- center=data(index(cn),:);
- this_class=zeros(m,1);%统计漂移过程中,每个点的访问频率
- %步骤2、3、4、5
- while 1
- %计算球半径内的点集
- dis=sum((repmat(center,m,1)-data).^2,2);
- radius2=radius*radius;
- innerS=find(dis<radius*radius);
- visitflag(innerS)=1;%在均值漂移过程中,记录已经被访问过得点
- this_class(innerS)=this_class(innerS)+1;
- %根据漂移公式,计算新的圆心位置
- newcenter=zeros(1,2);
- % newcenter= mean(data(innerS,:),1);
- sumweight=0;
- for i=1:length(innerS)
- w=exp(dis(innerS(i))/(radius*radius));
- sumweight=w+sumweight;
- newcenter=newcenter+w*data(innerS(i),:);
- end
- newcenter=newcenter./sumweight;
- if norm(newcenter-center) <stopthresh%计算漂移距离,如果漂移距离小于阈值,那么停止漂移
- break;
- end
- center=newcenter;
- plot(center(1),center(2),'*y');
- end
- %步骤6 判断是否需要合并,如果不需要则增加聚类个数1个
- mergewith=0;
- for i=1:clustern
- betw=norm(center-clustercenter(i,:));
- if betw<radius/2
- mergewith=i;
- break;
- end
- end
- if mergewith==0 %不需要合并
- clustern=clustern+1;
- clustercenter(clustern,:)=center;
- count(:,clustern)=this_class;
- else %合并
- clustercenter(mergewith,:)=0.5*(clustercenter(mergewith,:)+center);
- count(:,mergewith)=count(:,mergewith)+this_class;
- end
- %重新统计未被访问过的点
- index=find(visitflag==0);
- end%结束所有数据点访问
- %绘制分类结果
- for i=1:m
- [value index]=max(count(i,:));
- Idx(i)=index;
- end
- figure(2);
- hold on;
- for i=1:m
- if Idx(i)==1;
- plot(data(i,1),data(i,2),'.y');
- elseif Idx(i)==2;
- plot(data(i,1),data(i,2),'.b');
- elseif Idx(i)==3;
- plot(data(i,1),data(i,2),'.r');
- elseif Idx(i)==4;
- plot(data(i,1),data(i,2),'.k');
- elseif Idx(i)==5;
- plot(data(i,1),data(i,2),'.g');
- end
- end
- cVec = 'bgrcmykbgrcmykbgrcmykbgrcmyk';
- for k = 1:clustern
- plot(clustercenter(k,1),clustercenter(k,2),'o','MarkerEdgeColor','k','MarkerFaceColor',cVec(k), 'MarkerSize',10)
- end
在图像分割、图像跟踪,需要加入核函数。
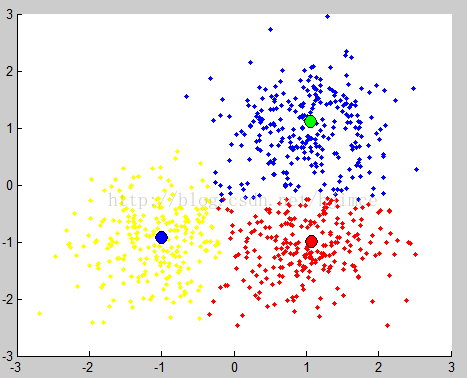
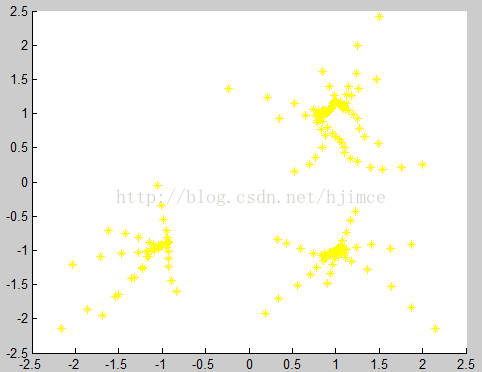
聚类结果 圆心漂移轨迹
*********作者:hjimce 联系qq:1393852684 更多资源请关注我的博客:http://blog.csdn.net/hjimce 原创文章,转载请保留本行信息。*****************
第二篇转自:http://blog.csdn.net/jinshengtao/article/details/30258833,版权归原作者所有。
一、简介
首先扯扯无参密度估计理论,无参密度估计也叫做非参数估计,属于数理统计的一个分支,和参数密度估计共同构成了概率密度估计方法。参数密度估计方法要求特征空间服从一个已知的概率密度函数,在实际的应用中这个条件很难达到。而无参数密度估计方法对先验知识要求最少,完全依靠训练数据进行估计,并且可以用于任意形状的密度估计。所以依靠无参密度估计方法,即不事先规定概率密度函数的结构形式,在某一连续点处的密度函数值可由该点邻域中的若干样本点估计得出。常用的无参密度估计方法有:直方图法、最近邻域法和核密度估计法。
MeanShift算法正是属于核密度估计法,它不需要任何先验知识而完全依靠特征空间中样本点的计算其密度函数值。对于一组采样数据,直方图法通常把数据的值域分成若干相等的区间,数据按区间分成若干组,每组数据的个数与总参数个数的比率就是每个单元的概率值;核密度估计法的原理相似于直方图法,只是多了一个用于平滑数据的核函数。采用核函数估计法,在采样充分的情况下,能够渐进地收敛于任意的密度函数,即可以对服从任何分布的数据进行密度估计。
然后谈谈MeanShift的基本思想及物理含义:
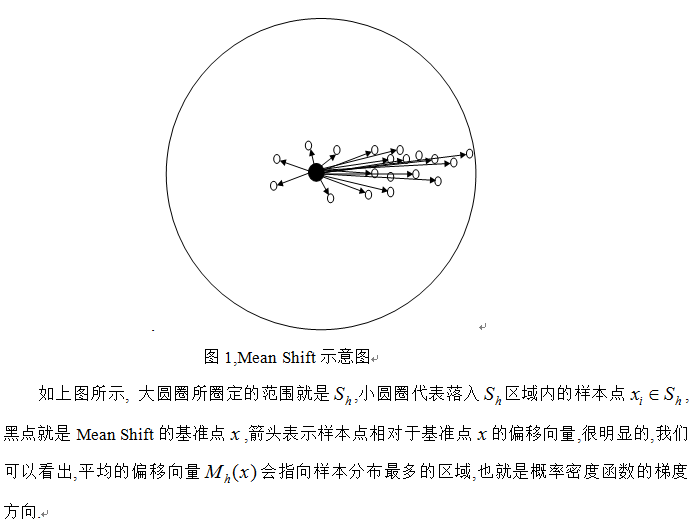
此外,从公式1中可以看到,只要是落入Sh的采样点,无论其离中心x的远近,对最终的Mh(x)计算的贡献是一样的。然而在现实跟踪过程中,当跟踪目标出现遮挡等影响时,由于外层的像素值容易受遮挡或背景的影响,所以目标模型中心附近的像素比靠外的像素更可靠。因此,对于所有采样点,每个样本点的重要性应该是不同的,离中心点越远,其权值应该越小。故引入核函数和权重系数来提高跟踪算法的鲁棒性并增加搜索跟踪能力。
接下来,谈谈核函数:
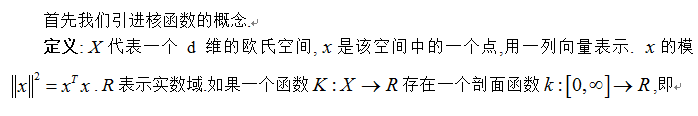
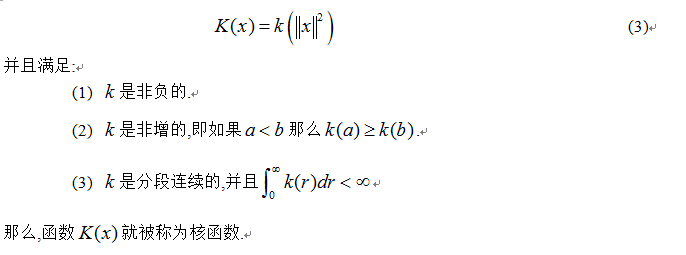
核函数也叫窗口函数,在核估计中起到平滑的作用。常用的核函数有:Uniform,Epannechnikov,Gaussian等。本文算法只用到了Epannechnikov,它数序定义如下:

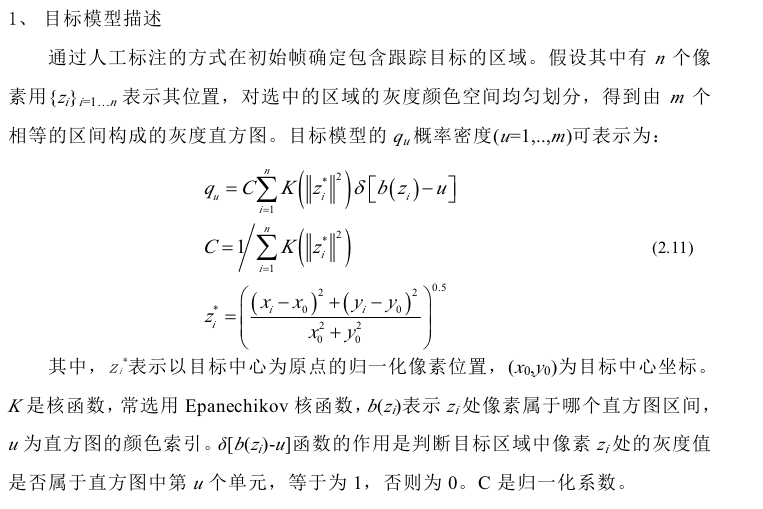
二、基于MeanShift的目标跟踪算法
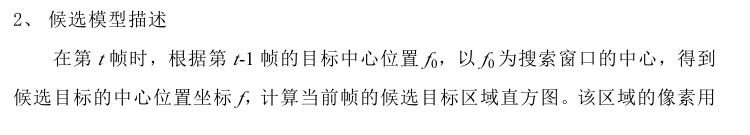
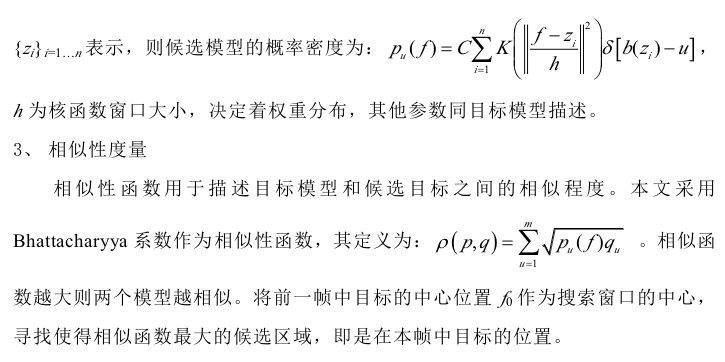
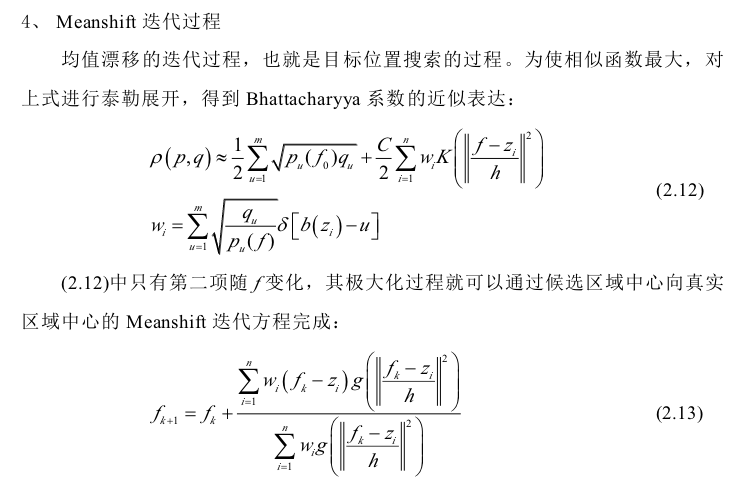
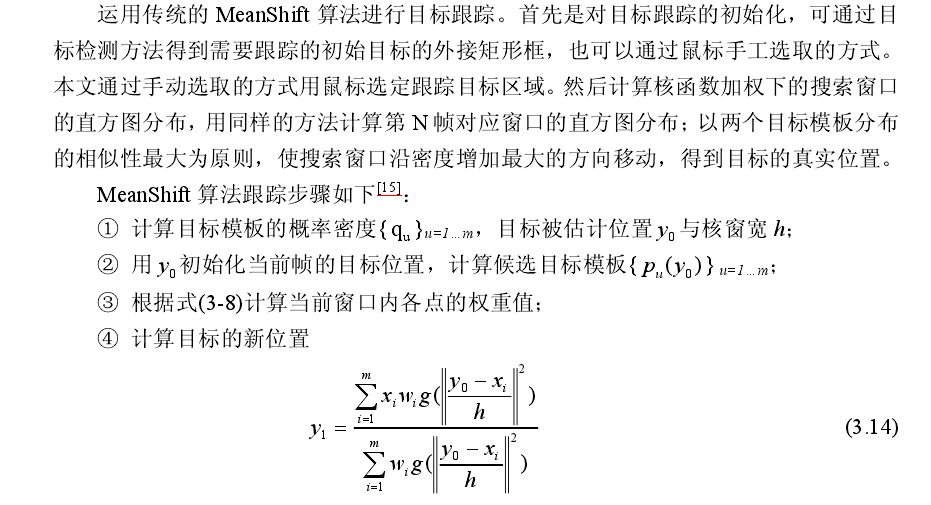
基于均值漂移的目标跟踪算法通过分别计算目标区域和候选区域内像素的特征值概率得到关于目标模型和候选模型的描述,然后利用相似函数度量初始帧目标模型和当前帧的候选模版的相似性,选择使相似函数最大的候选模型并得到关于目标模型的Meanshift向量,这个向量正是目标由初始位置向正确位置移动的向量。由于均值漂移算法的快速收敛性,通过不断迭代计算Meanshift向量,算法最终将收敛到目标的真实位置,达到跟踪的目的。
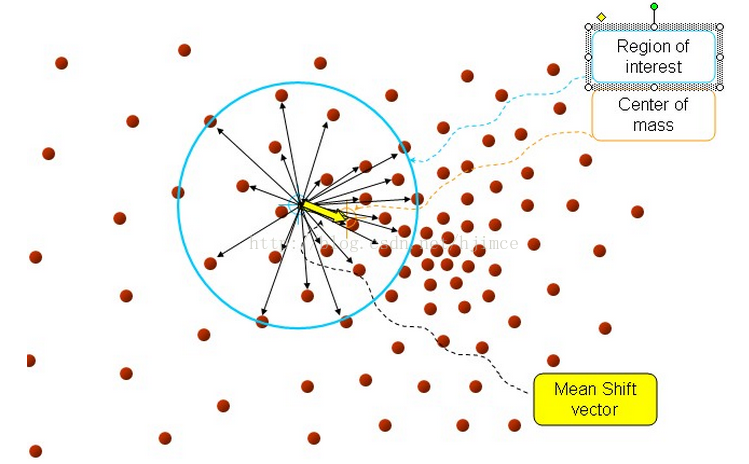
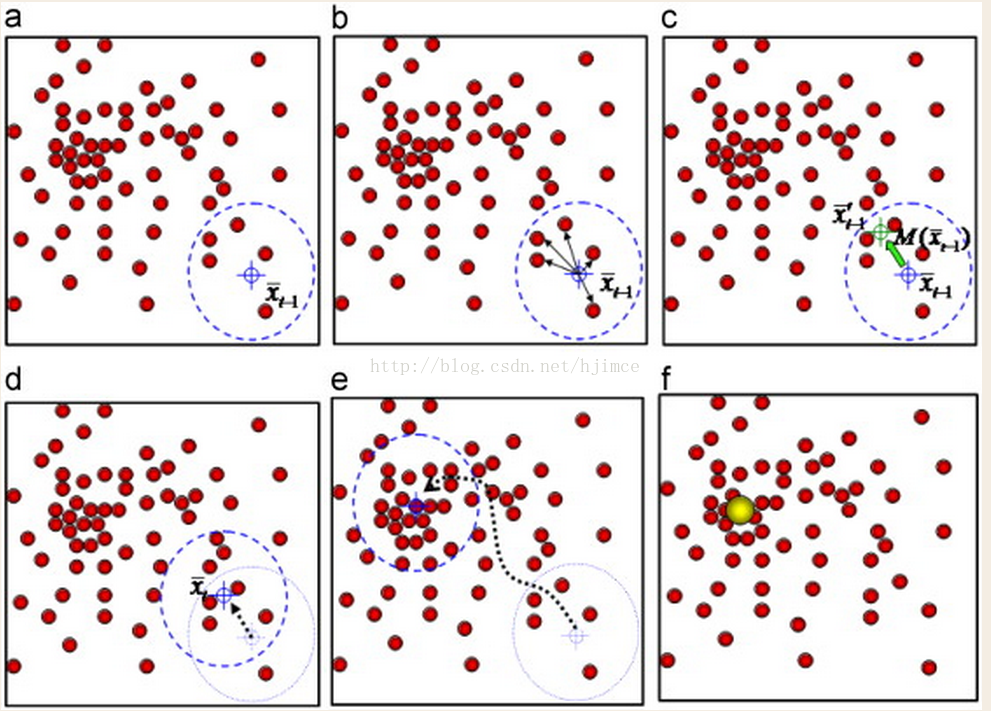
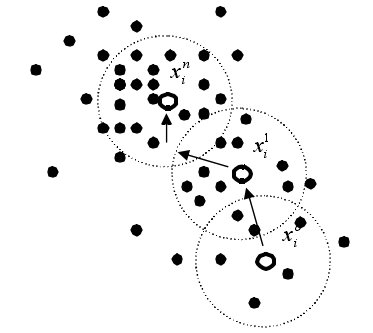
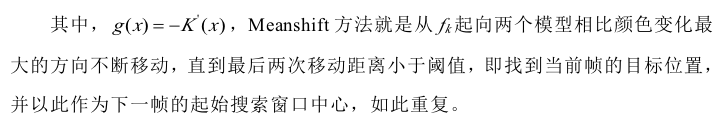
下面通过图示直观的说明MeanShift跟踪算法的基本原理。如下图所示:目标跟踪开始于数据点xi0(空心圆点xi0,xi1,…,xiN表示的是中心点,上标表示的是的迭代次数,周围的黑色圆点表示不断移动中的窗口样本点,虚线圆圈代表的是密度估计窗口的大小)。箭头表示样本点相对于核函数中心点的漂移向量,平均的漂移向量会指向样本点最密集的方向,也就是梯度方向。因为 Meanshift 算法是收敛的,因此在当前帧中通过反复迭代搜索特征空间中样本点最密集的区域,搜索点沿着样本点密度增加的方向“漂移”到局部密度极大点点xiN,也就是被认为的目标位置,从而达到跟踪的目的,MeanShift 跟踪过程结束。
运动目标的实现过程【具体算法】:
三、代码实现
说明:
1. RGB颜色空间刨分,采用16*16*16的直方图
2. 目标模型和候选模型的概率密度计算公式参照上文
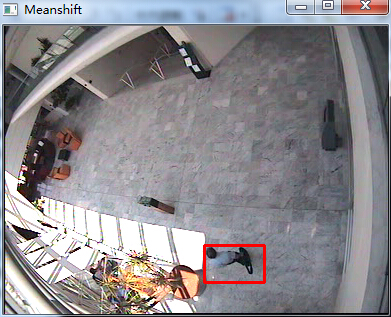
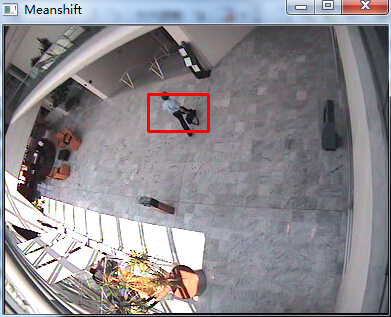
3. opencv版本运行:按P停止,截取目标,再按P,进行单目标跟踪
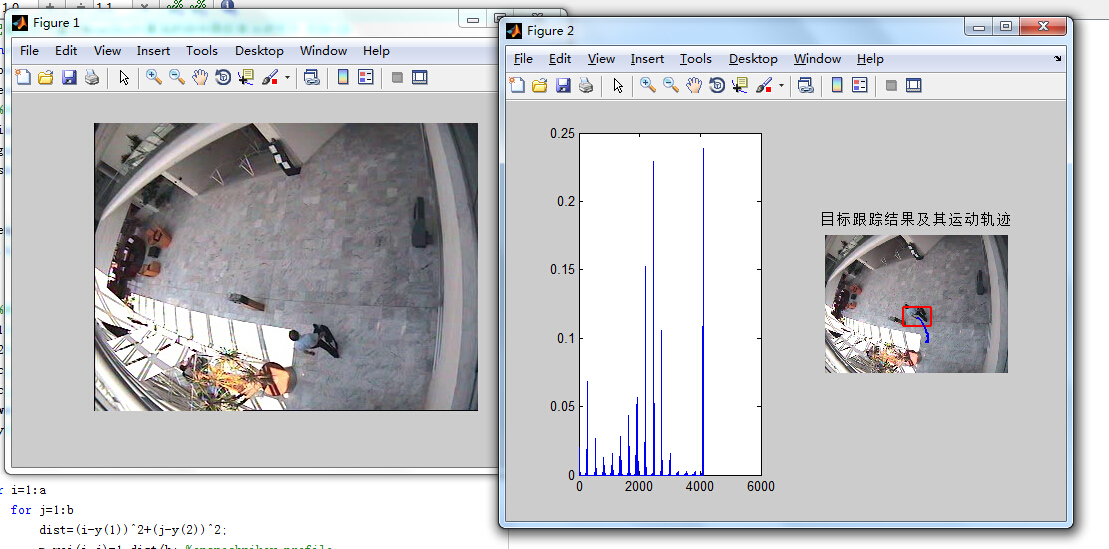
4. Matlab版本,将视频改为图片序列,第一帧停止,手工标定目标,双击目标区域,进行单目标跟踪。
matlab版本:
-
function [] = select()
-
close all;
-
clear all;
-
%%%%%%%%%%%%%%%%%%根据一幅目标全可见的图像圈定跟踪目标%%%%%%%%%%%%%%%%%%%%%%%
-
I=imread(
'result72.jpg');
-
figure(
1);
-
imshow(I);
-
-
-
[temp,rect]=imcrop(I);
-
[a,b,c]=size(temp); %a:row,b:col
-
-
-
%%%%%%%%%%%%%%%%%%%%%%%%%%%%%%%%计算目标图像的权值矩阵%%%%%%%%%%%%%%%%%%%%%%%
-
y(
1)=a/
2;
-
y(
2)=b/
2;
-
tic_x=rect(
1)+rect(
3)/
2;
-
tic_y=rect(
2)+rect(
4)/
2;
-
m_wei=zeros(a,b);%权值矩阵
-
h=y(
1)^
2+y(
2)^
2 ;%带宽
-
-
-
for i=
1:a
-
for j=
1:b
-
dist=(i-y(
1))^
2+(j-y(
2))^
2;
-
m_wei(i,j)=
1-dist/h; %epanechnikov profile
-
end
-
end
-
C=
1/sum(sum(m_wei));%归一化系数
-
-
-
%计算目标权值直方图qu
-
%hist1=C*wei_hist(temp,m_wei,a,b);%target model
-
hist1=zeros(
1,
4096);
-
for i=
1:a
-
for j=
1:b
-
%rgb颜色空间量化为
16*
16*
16 bins
-
q_r=fix(
double(temp(i,j,
1))/
16); %fix为趋近
0取整函数
-
q_g=fix(
double(temp(i,j,
2))/
16);
-
q_b=fix(
double(temp(i,j,
3))/
16);
-
q_temp=q_r*
256+q_g*
16+q_b; %设置每个像素点红色、绿色、蓝色分量所占比重
-
hist1(q_temp+
1)= hist1(q_temp+
1)+m_wei(i,j); %计算直方图统计中每个像素点占的权重
-
end
-
end
-
hist1=hist1*C;
-
rect(
3)=
ceil(rect(
3));
-
rect(
4)=
ceil(rect(
4));
-
-
-
-
-
%%%%%%%%%%%%%%%%%%%%%%%%%读取序列图像
-
myfile=dir(
'D:\matlab7\work\mean shift\image\*.jpg');
-
lengthfile=length(myfile);
-
-
-
for l=
1:lengthfile
-
Im=imread(myfile(l).name);
-
num=
0;
-
Y=[
2,
2];
-
-
-
%%%%%%%mean shift迭代
-
while((Y(
1)^
2+Y(
2)^
2>
0.5)&num<
20) %迭代条件
-
num=num+
1;
-
temp1=imcrop(Im,rect);
-
%计算侯选区域直方图
-
%hist2=C*wei_hist(temp1,m_wei,a,b);%target candidates pu
-
hist2=zeros(
1,
4096);
-
for i=
1:a
-
for j=
1:b
-
q_r=fix(
double(temp1(i,j,
1))/
16);
-
q_g=fix(
double(temp1(i,j,
2))/
16);
-
q_b=fix(
double(temp1(i,j,
3))/
16);
-
q_temp1(i,j)=q_r*
256+q_g*
16+q_b;
-
hist2(q_temp1(i,j)+
1)= hist2(q_temp1(i,j)+
1)+m_wei(i,j);
-
end
-
end
-
hist2=hist2*C;
-
figure(
2);
-
subplot(
1,
2,
1);
-
plot(hist2);
-
hold on;
-
-
w=zeros(
1,
4096);
-
for i=
1:
4096
-
if(hist2(i)~=
0) %不等于
-
w(i)=
sqrt(hist1(i)/hist2(i));
-
else
-
w(i)=
0;
-
end
-
end
-
-
-
-
%变量初始化
-
sum_w=
0;
-
xw=[
0,
0];
-
for i=
1:a;
-
for j=
1:b
-
sum_w=sum_w+w(uint32(q_temp1(i,j))+
1);
-
xw=xw+w(uint32(q_temp1(i,j))+
1)*[i-y(
1)
-0.5,j-y(
2)
-0.5];
-
end
-
end
-
Y=xw/sum_w;
-
%中心点位置更新
-
rect(
1)=rect(
1)+Y(
2);
-
rect(
2)=rect(
2)+Y(
1);
-
end
-
-
-
%%%跟踪轨迹矩阵%%%
-
tic_x=[tic_x;rect(
1)+rect(
3)/
2];
-
tic_y=[tic_y;rect(
2)+rect(
4)/
2];
-
-
v1=rect(
1);
-
v2=rect(
2);
-
v3=rect(
3);
-
v4=rect(
4);
-
%%%显示跟踪结果%%%
-
subplot(
1,
2,
2);
-
imshow(uint8(Im));
-
title(
'目标跟踪结果及其运动轨迹');
-
hold on;
-
plot([v1,v1+v3],[v2,v2],[v1,v1],[v2,v2+v4],[v1,v1+v3],[v2+v4,v2+v4],[v1+v3,v1+v3],[v2,v2+v4],
'LineWidth',
2,
'Color',
'r');
-
plot(tic_x,tic_y,
'LineWidth',
2,
'Color',
'b');
-
end
运行结果:
opencv版本:
-
#include "stdafx.h"
-
#include "cv.h"
-
#include "highgui.h"
-
#define u_char unsigned char
-
#define DIST 0.5
-
#define NUM 20
-
-
//全局变量
-
bool pause =
false;
-
bool is_tracking =
false;
-
CvRect drawing_box;
-
IplImage *current;
-
double *hist1, *hist2;
-
double *m_wei;
//权值矩阵
-
double C =
0.0;
//归一化系数
-
-
void init_target(double *hist1, double *m_wei, IplImage *current)
-
{
-
IplImage *pic_hist =
0;
-
int t_h, t_w, t_x, t_y;
-
double h, dist;
-
int i, j;
-
int q_r, q_g, q_b, q_temp;
-
-
t_h = drawing_box.height;
-
t_w = drawing_box.width;
-
t_x = drawing_box.x;
-
t_y = drawing_box.y;
-
-
h =
pow(((
double)t_w)/
2,
2) +
pow(((
double)t_h)/
2,
2);
//带宽
-
pic_hist = cvCreateImage(cvSize(
300,
200),IPL_DEPTH_8U,
3);
//生成直方图图像
-
-
//初始化权值矩阵和目标直方图
-
for (i =
0;i < t_w*t_h;i++)
-
{
-
m_wei[i] =
0.0;
-
}
-
-
for (i=
0;i<
4096;i++)
-
{
-
hist1[i] =
0.0;
-
}
-
-
for (i =
0;i < t_h; i++)
-
{
-
for (j =
0;j < t_w; j++)
-
{
-
dist =
pow(i - (
double)t_h/
2,
2) +
pow(j - (
double)t_w/
2,
2);
-
m_wei[i * t_w + j] =
1 - dist / h;
-
//printf("%f\n",m_wei[i * t_w + j]);
-
C += m_wei[i * t_w + j] ;
-
}
-
}
-
-
//计算目标权值直方
-
for (i = t_y;i < t_y + t_h; i++)
-
{
-
for (j = t_x;j < t_x + t_w; j++)
-
{
-
//rgb颜色空间量化为16*16*16 bins
-
q_r = ((u_char)current->imageData[i * current->widthStep + j *
3 +
2]) /
16;
-
q_g = ((u_char)current->imageData[i * current->widthStep + j *
3 +
1]) /
16;
-
q_b = ((u_char)current->imageData[i * current->widthStep + j *
3 +
0]) /
16;
-
q_temp = q_r *
256 + q_g *
16 + q_b;
-
hist1[q_temp] = hist1[q_temp] + m_wei[(i - t_y) * t_w + (j - t_x)] ;
-
}
-
}
-
-
//归一化直方图
-
for (i=
0;i<
4096;i++)
-
{
-
hist1[i] = hist1[i] / C;
-
//printf("%f\n",hist1[i]);
-
}
-
-
//生成目标直方图
-
double temp_max=
0.0;
-
-
for (i =
0;i <
4096;i++)
//求直方图最大值,为了归一化
-
{
-
//printf("%f\n",val_hist[i]);
-
if (temp_max < hist1[i])
-
{
-
temp_max = hist1[i];
-
}
-
}
-
//画直方图
-
CvPoint p1,p2;
-
double bin_width=(
double)pic_hist->width/
4096;
-
double bin_unith=(
double)pic_hist->height/temp_max;
-
-
for (i =
0;i <
4096; i++)
-
{
-
p1.x = i * bin_width;
-
p1.y = pic_hist->height;
-
p2.x = (i +
1)*bin_width;
-
p2.y = pic_hist->height - hist1[i] * bin_unith;
-
//printf("%d,%d,%d,%d\n",p1.x,p1.y,p2.x,p2.y);
-
cvRectangle(pic_hist,p1,p2,cvScalar(
0,
255,
0),
-1,
8,
0);
-
}
-
cvSaveImage(
"hist1.jpg",pic_hist);
-
cvReleaseImage(&pic_hist);
-
}
-
-
void MeanShift_Tracking(IplImage *current)
-
{
-
int num =
0, i =
0, j =
0;
-
int t_w =
0, t_h =
0, t_x =
0, t_y =
0;
-
double *w =
0, *hist2 =
0;
-
double sum_w =
0, x1 =
0, x2 =
0,y1 =
2.0, y2 =
2.0;
-
int q_r, q_g, q_b;
-
int *q_temp;
-
IplImage *pic_hist =
0;
-
-
t_w = drawing_box.width;
-
t_h = drawing_box.height;
-
-
pic_hist = cvCreateImage(cvSize(
300,
200),IPL_DEPTH_8U,
3);
//生成直方图图像
-
hist2 = (
double *)
malloc(
sizeof(
double)*
4096);
-
w = (
double *)
malloc(
sizeof(
double)*
4096);
-
q_temp = (
int *)
malloc(
sizeof(
int)*t_w*t_h);
-
-
while ((
pow(y2,
2) +
pow(y1,
2) >
0.5)&& (num < NUM))
-
{
-
num++;
-
t_x = drawing_box.x;
-
t_y = drawing_box.y;
-
memset(q_temp,
0,
sizeof(
int)*t_w*t_h);
-
for (i =
0;i<
4096;i++)
-
{
-
w[i] =
0.0;
-
hist2[i] =
0.0;
-
}
-
-
for (i = t_y;i < t_h + t_y;i++)
-
{
-
for (j = t_x;j < t_w + t_x;j++)
-
{
-
//rgb颜色空间量化为16*16*16 bins
-
q_r = ((u_char)current->imageData[i * current->widthStep + j *
3 +
2]) /
16;
-
q_g = ((u_char)current->imageData[i * current->widthStep + j *
3 +
1]) /
16;
-
q_b = ((u_char)current->imageData[i * current->widthStep + j *
3 +
0]) /
16;
-
q_temp[(i - t_y) *t_w + j - t_x] = q_r *
256 + q_g *
16 + q_b;
-
hist2[q_temp[(i - t_y) *t_w + j - t_x]] = hist2[q_temp[(i - t_y) *t_w + j - t_x]] + m_wei[(i - t_y) * t_w + j - t_x] ;
-
}
-
}
-
-
//归一化直方图
-
for (i=
0;i<
4096;i++)
-
{
-
hist2[i] = hist2[i] / C;
-
//printf("%f\n",hist2[i]);
-
}
-
//生成目标直方图
-
double temp_max=
0.0;
-
-
for (i=
0;i<
4096;i++)
//求直方图最大值,为了归一化
-
{
-
if (temp_max < hist2[i])
-
{
-
temp_max = hist2[i];
-
}
-
}
-
//画直方图
-
CvPoint p1,p2;
-
double bin_width=(
double)pic_hist->width/(
4368);
-
double bin_unith=(
double)pic_hist->height/temp_max;
-
-
for (i =
0;i <
4096; i++)
-
{
-
p1.x = i * bin_width;
-
p1.y = pic_hist->height;
-
p2.x = (i +
1)*bin_width;
-
p2.y = pic_hist->height - hist2[i] * bin_unith;
-
cvRectangle(pic_hist,p1,p2,cvScalar(
0,
255,
0),
-1,
8,
0);
-
}
-
cvSaveImage(
"hist2.jpg",pic_hist);
-
-
for (i =
0;i <
4096;i++)
-
{
-
if (hist2[i] !=
0)
-
{
-
w[i] =
sqrt(hist1[i]/hist2[i]);
-
}
else
-
{
-
w[i] =
0;
-
}
-
}
-
-
sum_w =
0.0;
-
x1 =
0.0;
-
x2 =
0.0;
-
-
for (i =
0;i < t_h; i++)
-
{
-
for (j =
0;j < t_w; j++)
-
{
-
//printf("%d\n",q_temp[i * t_w + j]);
-
sum_w = sum_w + w[q_temp[i * t_w + j]];
-
x1 = x1 + w[q_temp[i * t_w + j]] * (i - t_h/
2);
-
x2 = x2 + w[q_temp[i * t_w + j]] * (j - t_w/
2);
-
}
-
}
-
y1 = x1 / sum_w;
-
y2 = x2 / sum_w;
-
-
//中心点位置更新
-
drawing_box.x += y2;
-
drawing_box.y += y1;
-
-
//printf("%d,%d\n",drawing_box.x,drawing_box.y);
-
}
-
free(hist2);
-
free(w);
-
free(q_temp);
-
//显示跟踪结果
-
cvRectangle(current,cvPoint(drawing_box.x,drawing_box.y),cvPoint(drawing_box.x+drawing_box.width,drawing_box.y+drawing_box.height),CV_RGB(
255,
0,
0),
2);
-
cvShowImage(
"Meanshift",current);
-
//cvSaveImage("result.jpg",current);
-
cvReleaseImage(&pic_hist);
-
}
-
-
void onMouse( int event, int x, int y, int flags, void *param )
-
{
-
if (pause)
-
{
-
switch(event)
-
{
-
case CV_EVENT_LBUTTONDOWN:
-
//the left up point of the rect
-
drawing_box.x=x;
-
drawing_box.y=y;
-
break;
-
case CV_EVENT_LBUTTONUP:
-
//finish drawing the rect (use color green for finish)
-
drawing_box.width=x-drawing_box.x;
-
drawing_box.height=y-drawing_box.y;
-
cvRectangle(current,cvPoint(drawing_box.x,drawing_box.y),cvPoint(drawing_box.x+drawing_box.width,drawing_box.y+drawing_box.height),CV_RGB(
255,
0,
0),
2);
-
cvShowImage(
"Meanshift",current);
-
-
//目标初始化
-
hist1 = (
double *)
malloc(
sizeof(
double)*
16*
16*
16);
-
m_wei = (
double *)
malloc(
sizeof(
double)*drawing_box.height*drawing_box.width);
-
init_target(hist1, m_wei, current);
-
is_tracking =
true;
-
break;
-
}
-
return;
-
}
-
}
-
-
-
-
int _tmain(
int argc, _TCHAR* argv[])
-
{
-
CvCapture *capture=cvCreateFileCapture(
"test.avi");
-
current = cvQueryFrame(capture);
-
char res[
20];
-
int nframe =
0;
-
-
while (
1)
-
{
-
/* sprintf(res,"result%d.jpg",nframe);
-
cvSaveImage(res,current);
-
nframe++;*/
-
if(is_tracking)
-
{
-
MeanShift_Tracking(current);
-
}
-
-
int c=cvWaitKey(
1);
-
//暂停
-
if(c ==
'p')
-
{
-
pause =
true;
-
cvSetMouseCallback(
"Meanshift", onMouse,
0 );
-
}
-
while(pause){
-
if(cvWaitKey(
0) ==
'p')
-
pause =
false;
-
}
-
cvShowImage(
"Meanshift",current);
-
current = cvQueryFrame(capture);
//抓取一帧
-
}
-
-
cvNamedWindow(
"Meanshift",
1);
-
cvReleaseCapture(&capture);
-
cvDestroyWindow(
"Meanshift");
-
return
0;
-
}
运行结果:
初始目标直方图:
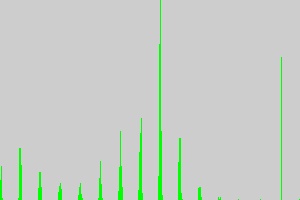
候选目标直方图: