Mean Shift算法,又称均值聚类算法,聚类中心是通过在给定区域中的样本均值确定的,通过不断更新聚类中心,直到聚类中心不再改变为止,在聚类、图像平滑、分割和视频跟踪等方面有广泛的运用。
Mean Shift向量
对于给定的n维空间
中的m个样本点
对于其中的一个样本X,其Mean Shift向量为:
其中
指的是一个半径为h的高维球区域,定义为:
Mean Shift算法原理
步骤1:在指定区域内计算出每个样本点漂移均值;
步骤2:移动该点到漂移均值处;
步骤3:重复上述过程;
步骤4:当满足条件时,退出
Mean Shift算法流程
(1) 计算
;
(2)令
;
(3) 如果
,结束循环,否则重复上述步骤。
Mean Shift向量:
记
则上式变成:
且
为高斯核函数。
Python实现
(1)计算两个点的欧式距离:
def euclidean_dist(pointA, pointB):
    '''计算欧式距离
    input:  pointA(mat):A点的坐标
            pointB(mat):B点的坐标
    output: math.sqrt(total):两点之间的欧式距离
    '''
    # 计算pointA和pointB之间的欧式距离
    total = (pointA - pointB) * (pointA - pointB).T
    return math.sqrt(total)  # 欧式距离
(2)计算高斯核函数:
def gaussian_kernel(distance, bandwidth):
    '''高斯核函数
    input:  distance(mat):欧式距离
            bandwidth(int):核函数的带宽
    output: gaussian_val(mat):高斯函数值
    '''
    m = np.shape(distance)[0]  # 样本个数
    right = np.mat(np.zeros((m, 1)))  # mX1的矩阵
    for i in range(m):
        right[i, 0] = (-0.5 * distance[i] * distance[i].T) / (bandwidth * bandwidth)
        right[i, 0] = np.exp(right[i, 0])
    left = 1 / (bandwidth * math.sqrt(2 * math.pi))

    gaussian_val = left * right
    return gaussian_val
(3)计算均值漂移点
def shift_point(point, points, kernel_bandwidth):
    '''计算均值漂移点
    input:  point(mat)需要计算的点
            points(array)所有的样本点
            kernel_bandwidth(int)核函数的带宽
    output: point_shifted(mat)漂移后的点
    '''
    points = np.mat(points)
    m = np.shape(points)[0]  # 样本的个数
    # 计算距离
    point_distances = np.mat(np.zeros((m, 1)))
    for i in range(m):
        point_distances[i, 0] = euclidean_dist(point, points[i])

    # 计算高斯核
    point_weights = gaussian_kernel(point_distances, kernel_bandwidth)  # mX1的矩阵

    # 计算分母
    all_sum = 0.0
    for i in range(m):
        all_sum += point_weights[i, 0]

    # 均值偏移
    point_shifted = point_weights.T * points / all_sum
    return point_shifted
(4)迭代更新漂移均值(训练过程)
def train_mean_shift(points, kenel_bandwidth=2):
    '''训练Mean shift模型
    input:  points(array):特征数据
            kenel_bandwidth(int):核函数的带宽
    output: points(mat):特征点
            mean_shift_points(mat):均值漂移点
            group(array):类别
    '''
    mean_shift_points = np.mat(points)
    max_min_dist = 1
    iteration = 0  # 训练的代数
    m = np.shape(mean_shift_points)[0]  # 样本的个数
    need_shift = [True] * m  # 标记是否需要漂移

    # 计算均值漂移向量
    while max_min_dist > MIN_DISTANCE:
        max_min_dist = 0
        iteration += 1
        print("\titeration : " + str(iteration))
        for i in range(0, m):
            # 判断每一个样本点是否需要计算偏移均值
            if not need_shift[i]:
                continue
            p_new = mean_shift_points[i]
            p_new_start = p_new
            p_new = shift_point(p_new, points, kenel_bandwidth)  # 对样本点进行漂移
            dist = euclidean_dist(p_new, p_new_start)  # 计算该点与漂移后的点之间的距离

            if dist > max_min_dist:
                max_min_dist = dist
            if dist < MIN_DISTANCE:  # 不需要移动
                need_shift[i] = False

            mean_shift_points[i] = p_new

    # 计算最终的group
    group = group_points(mean_shift_points)  # 计算所属的类别

    return np.mat(points), mean_shift_points, group
(5)数据源:
10.91079039	8.389412017
9.875001645	9.9092509
7.8481223	10.4317483
8.534122932	9.559085609
10.38316846	9.618790857
8.110615952	9.774717608
10.02119468	9.538779622
9.37705852	9.708539909
7.670170335	9.603152306
10.94308287	11.76207349
9.247308233	10.90210555
9.54739729	11.36170176
7.833343667	10.363034
10.87045922	9.213348128
8.228513384	10.46791102
12.48299028	9.421228147
6.557229658	11.05935349
7.264259221	9.984256737
4.801721592	7.557912927
6.861248648	7.837006973
13.62724419	10.94830031
13.6552565	9.924983717
9.606090699	10.29198795
12.43565716	8.813439258
10.0720656	9.160571589
8.306703028	10.4411646
8.772436599	10.84579091
9.841416158	9.848307202
15.11169184	12.48989787
10.2774241	9.85657011
10.1348076	8.892774944
8.426586093	11.30023345
9.191199877	9.989869949
5.933268578	10.21740004
9.666055456	10.68814946
5.762091216	10.12453436
5.224273746	9.98492559
10.26868537	10.31605475
10.92376708	10.93351512
8.935799678	9.181397458
2.978214427	3.835470435
4.91744201	2.674339991
3.024557256	4.807509213
3.019226157	4.041811881
4.131521545	2.520604653
0.411345842	3.655696597
5.266443567	5.594882041
4.62354099	1.375919061
5.67864342	2.757973123
3.905462712	2.141625079
8.085352646	2.58833713
6.852035583	3.610319053
4.230846663	3.563377115
6.042905325	2.358886853
4.20077289	2.382387946
4.284037893	7.051142553
3.820640884	4.607385052
5.417685111	3.436339164
8.21146303	3.570609885
6.543095544	-0.150071185
9.217248861	2.40193675
6.673038102	3.307612539
4.043040861	4.849836388
3.704103266	2.252629794
4.908162271	3.870390681
5.656217904	2.243552275
5.091797066	3.509500134
6.334045598	3.517609974
6.820587567	3.871837206
7.209440437	2.853110887
2.099723775	2.256027992
4.720205587	2.620700716
6.221986574	4.665191116
5.076992534	2.359039927
3.263027769	0.652069899
3.639219475	2.050486686
7.250113206	2.633190935
4.28693774	0.741841034
4.489176633	1.847389784
6.223476314	2.226009922
2.732684384	4.026711236
6.704126155	1.241378687
6.406730922	6.430816427
3.082162445	3.603531758
3.719431124	5.345215168
6.190401933	6.922594241
8.101883247	4.283883063
2.666738151	1.251248672
5.156253707	2.957825121
6.832208664	3.004741194
-1.523668483	6.870939176
-6.278045454	5.054520751
-4.130089867	3.308967776
-2.298773883	2.524337553
-0.186372986	5.059834391
-5.184077845	5.32761477
-5.260618656	6.373336994
-4.067910691	4.56450199
-4.856398444	3.94371169
-5.169024046	7.199650795
-2.818717016	6.775475264
-3.013197129	5.307372667
-1.840258223	2.473016216
-3.806016495	3.099383642
-1.353873198	4.60008787
-5.422829607	5.540632064
-3.571899549	6.390529804
-4.037978273	4.70568099
-1.110354346	4.809405537
-3.8378779	6.029098753
-6.55038578	5.511809253
-5.816344971	7.813937668
-4.626894927	8.979880178
-3.230779355	3.295580582
-4.333569224	5.593364339
-3.282896829	6.590185797
-7.646892109	7.527347421
-6.461822847	5.62944836
-6.368216425	7.083861849
-4.284758729	3.842576327
-2.29626659	7.288576999
1.101278199	6.548796127
-5.927942727	8.655087775
-3.954602311	5.733640188
-3.160876539	4.267409415
完整代码
# -*- coding: utf-8 -*-
"""
Created on Sun Oct 14 21:52:09 2018

@author: ASUS
"""
import math
import numpy as np
import matplotlib.pyplot as plt
MIN_DISTANCE = 0.000001  # mini error

def load_data(path, feature_num=2):
    '''导入数据
    input:  path(string)文件的存储位置
            feature_num(int)特征的个数
    output: data(array)特征
    '''
    f = open(path)  # 打开文件
    data = []
    for line in f.readlines():
        lines = line.strip().split("\t")
        data_tmp = []
        if len(lines) != feature_num:  # 判断特征的个数是否正确
            continue
        for i in range(feature_num):
            data_tmp.append(float(lines[i]))
        data.append(data_tmp)
    f.close()  # 关闭文件
    return data

def gaussian_kernel(distance, bandwidth):
    '''高斯核函数
    input:  distance(mat):欧式距离
            bandwidth(int):核函数的带宽
    output: gaussian_val(mat):高斯函数值
    '''
    m = np.shape(distance)[0]  # 样本个数
    right = np.mat(np.zeros((m, 1)))  # mX1的矩阵
    for i in range(m):
        right[i, 0] = (-0.5 * distance[i] * distance[i].T) / (bandwidth * bandwidth)
        right[i, 0] = np.exp(right[i, 0])
    left = 1 / (bandwidth * math.sqrt(2 * math.pi))

    gaussian_val = left * right
    return gaussian_val

def shift_point(point, points, kernel_bandwidth):
    '''计算均值漂移点
    input:  point(mat)需要计算的点
            points(array)所有的样本点
            kernel_bandwidth(int)核函数的带宽
    output: point_shifted(mat)漂移后的点
    '''
    points = np.mat(points)
    m = np.shape(points)[0]  # 样本的个数
    # 计算距离
    point_distances = np.mat(np.zeros((m, 1)))
    for i in range(m):
        point_distances[i, 0] = euclidean_dist(point, points[i])

    # 计算高斯核
    point_weights = gaussian_kernel(point_distances, kernel_bandwidth)  # mX1的矩阵

    # 计算分母
    all_sum = 0.0
    for i in range(m):
        all_sum += point_weights[i, 0]

    # 均值偏移
    point_shifted = point_weights.T * points / all_sum
    return point_shifted

def euclidean_dist(pointA, pointB):
    '''计算欧式距离
    input:  pointA(mat):A点的坐标
            pointB(mat):B点的坐标
    output: math.sqrt(total):两点之间的欧式距离
    '''
    # 计算pointA和pointB之间的欧式距离
    total = (pointA - pointB) * (pointA - pointB).T
    return math.sqrt(total)  # 欧式距离

def group_points(mean_shift_points):
    '''计算所属的类别
    input:  mean_shift_points(mat):漂移向量
    output: group_assignment(array):所属类别
    '''
    group_assignment = []
    m, n = np.shape(mean_shift_points)
    index = 0
    index_dict = {}
    for i in range(m):
        item = []
        for j in range(n):
            item.append(str(("%5.2f" % mean_shift_points[i, j])))

        item_1 = "_".join(item)
        if item_1 not in index_dict:
            index_dict[item_1] = index
            index += 1

    for i in range(m):
        item = []
        for j in range(n):
            item.append(str(("%5.2f" % mean_shift_points[i, j])))

        item_1 = "_".join(item)
        group_assignment.append(index_dict[item_1])

    return group_assignment

def train_mean_shift(points, kenel_bandwidth=2):
    '''训练Mean shift模型
    input:  points(array):特征数据
            kenel_bandwidth(int):核函数的带宽
    output: points(mat):特征点
            mean_shift_points(mat):均值漂移点
            group(array):类别
    '''
    mean_shift_points = np.mat(points)
    max_min_dist = 1
    iteration = 0  # 训练的代数
    m = np.shape(mean_shift_points)[0]  # 样本的个数
    need_shift = [True] * m  # 标记是否需要漂移

    # 计算均值漂移向量
    while max_min_dist > MIN_DISTANCE:
        max_min_dist = 0
        iteration += 1
        print("\titeration : " + str(iteration))
        for i in range(0, m):
            # 判断每一个样本点是否需要计算偏移均值
            if not need_shift[i]:
                continue
            p_new = mean_shift_points[i]
            p_new_start = p_new
            p_new = shift_point(p_new, points, kenel_bandwidth)  # 对样本点进行漂移
            dist = euclidean_dist(p_new, p_new_start)  # 计算该点与漂移后的点之间的距离

            if dist > max_min_dist:
                max_min_dist = dist
            if dist < MIN_DISTANCE:  # 不需要移动
                need_shift[i] = False

            mean_shift_points[i] = p_new

    # 计算最终的group
    group = group_points(mean_shift_points)  # 计算所属的类别

    return np.mat(points), mean_shift_points, group

def save_result(file_name, data):
    '''保存最终的计算结果
    input:  file_name(string):存储的文件名
            data(mat):需要保存的文件
    '''
    f = open(file_name, "w")
    m, n = np.shape(data)
    for i in range(m):
        tmp = []
        for j in range(n):
            tmp.append(str(data[i, j]))
        f.write("\t".join(tmp) + "\n")
    f.close()


if __name__ == "__main__":
    color=['.r','.g','.b','.y']#颜色种类
    # 导入数据集
    print ("----------1.load data ------------")
    data = load_data("data", 2)
    N = len(data)
    # 训练,h=2
    print ("----------2.training ------------")
    points, shift_points, cluster = train_mean_shift(data, 2)
    # 保存所属的类别文件

   # save_result("center_1", shift_points)
    data = np.array(data)
    for i in range(N):
        if cluster[i]==0:
            plt.plot(data[i, 0], data[i, 1],'ro')
        elif cluster[i]==1:
            plt.plot(data[i, 0], data[i, 1],'go')
        elif cluster[i]==2:
            plt.plot(data[i, 0], data[i, 1],'bo')

    plt.show()
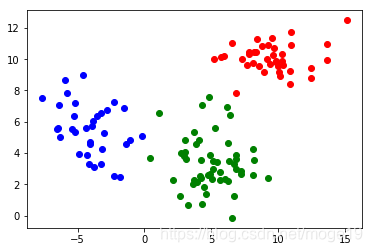
运行结果