目录
- SVM原理
- 某些API解释
- SVM实现
- 作业问题记录
- SVM优化
- SVM运用
- 参考文献
一、SVM原理
线性SVM分类是给每一个样本一个分数,其正确的分数应该比错误的分数大。在实际分类中,为了提高分类器的鲁棒性,我们希望正确的分数比错误的分数大得多一些,其差值为
其中,


训练总体损失函数为:
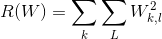
为了防止过拟合,用一个正则化项来衡量一个模型的复杂度。因此,其训练总体损失函数为:
![L = \frac{1}{N}\sum_{i}^{N}L_{i} + \lambda R(W) =\frac{1}{N}\sum_{i}^{N}\sum_{j\neq y_{i}}[max(0,w_{j}^{T}x - w_{y_{j}}^{T}x + 1)] +\lambda \sum_{k}\sum_{l}W_{k,l}^{2}](https://img-blog.csdnimg.cn/20181229125244341)
关于正则化,有L1正则化和L2正则化。
L1正则化能将权重矩阵稀疏化,比较注重个别较突出的值;
公式:
L2正则化更关注多个中等差异的值,有利于网络学到更多方面的特征。
公式:
举例:对于
,两个权重向量
,
。那么
,两个权重向量都得到同样的内积,但是
的L2惩罚是1.0(各项平方相加),而
的L2惩罚是0.25。因此,根据L2惩罚来看,
其他正则化方法:Elastic net(L1 + L2), Dropout, Batch normalization, Stochastic depth, fractional pooling, etc.
求导:
首先求一个样本的 Li 的一个分量 Lij 对 W 的列向量 wj 的偏导数, 对于大于 0 的Lij 才用求导数:
每一个大于零的项会给导数的两个列带来贡献,对于 j!=yi 的列向量,给导数的第 j 列带来 -xi 的贡献(dWj和一个样本xi包含的元素一样多,xi对应位置的分量给对应位置的dWj分量带来贡献),对于j==yi的列向量,带来xi的贡献:当
时,
当
时,
对 Li的每一个大于 0 的分量 Lij都求出给导数dW带来的贡献,就可以求得 Li 给 dW 带来的贡献。然后再多所有的样本累计求一遍,然后再除以样本总数,并加上正则项,就可以得到我们要求的 dW。
摘自https://blog.csdn.net/yc461515457/article/details/51921607


SVM是一种根据全部样本的标签进行拟合从而达到分类目的的方法,属于全局近似。
与KNN相比的优劣:
优点:
1.具有学习能力,分类速度快;
2.依据训练样本概率进行分类,具有一定的鲁棒性;
缺点:
1.不适合样本类别交叉或重叠较多的情况;
2.不存在非线性拟合的能力;
3.需要一次性拿到较多样本;
二、某些API解释
三、SVM实现
1.预处理:减去图片均值
SVM与KNN不同的是在进行计算之前,需要对所有图片进行减去均值的操作,原因在于这样可以将所有图片进行中心化,将其聚集在原点附近,从而提高模型的效果。从理论上来说,如图1-1所示,中心化后其偏置bias的值可以小一些,有利于加速后期的计算。对于其他的数据,通常也要标准化或归一化。
代码:计算所有图片每一像素点的均值。
# Preprocessing: subtract the mean image
# first: compute the image mean based on the training data
mean_image = np.mean(X_train, axis=0)
print (mean_image[:10]) # print a few of the elements
plt.figure(figsize=(4,4))
plt.imshow(mean_image.reshape((32,32,3)).astype('uint8')) # visualize the mean image
plt.show()结果:
[ 129.16667347  134.23142857  130.79826531  128.36589796  133.4004898
  129.92885714  129.62573469  134.69042857  130.9032449   129.91483673]
代码:每张图片都减去均值
# second: subtract the mean image from train and test data
X_train -= mean_image
X_val -= mean_image
X_test -= mean_image
X_dev -= mean_image
2.在样本中增加一维,从而可以将W和b放在一起训练。
代码:
# third: append the bias dimension of ones (i.e. bias trick) so that our SVM
# only has to worry about optimizing a single weight matrix W.
X_train = np.hstack([X_train, np.ones((X_train.shape[0], 1))])
X_val = np.hstack([X_val, np.ones((X_val.shape[0], 1))])
X_test = np.hstack([X_test, np.ones((X_test.shape[0], 1))])
X_dev = np.hstack([X_dev, np.ones((X_dev.shape[0], 1))])

print (X_train.shape, X_val.shape, X_test.shape, X_dev.shape)
结果:
(49000, 3073) (1000, 3073) (1000, 3073) (500, 3073)3. SVM朴素方法

def svm_loss_naive(W, X, y, reg):
    dW = np.zeros(W.shape)  # initialize the gradient as zero

    # compute the loss and the gradient
    num_classes = W.shape[1]
    num_train = X.shape[0]
    loss = 0.0
    for i in xrange(num_train):
        scores = X[i].dot(W)
        correct_class_score = scores[y[i]]
        for j in xrange(num_classes):
            if j == y[i]:
                continue
            margin = scores[j] - correct_class_score + 1  # note delta = 1
            if margin > 0:
                loss += margin
                # 如果 margin 大于 0,计算梯度
                dW[:, j] += X[i].T
                dW[:, y[i]] -= X[i].T

    # Right now the loss is a sum over all training examples, but we want it
    # to be an average instead so we divide by num_train.
    loss /= num_train
    # 对梯度除以 num_train 进行平均
    dW /= num_train

    # Add regularization to the loss.
    loss += reg * np.sum(W * W)
    # 对正则项求梯度
    dW += 2 * reg * W

    return loss, dW
4.SVM向量法

def svm_loss_vectorized(W, X, y, reg):
    loss = 0.0
    dW = np.zeros(W.shape)  # initialize the gradient as zero

    num_train = X.shape[0]  # 得到样本的数目
    scores = np.dot(X, W)  # 计算所有的得分
    y_score = scores[np.arange(num_train), y].reshape((-1, 1))  # 得到每个样本对应label的得分
    mask = (scores - y_score + 1) > 0  # 有效的score下标,多算label
    scores = (scores - y_score + 1) * mask  # 有效的得分
    loss = (np.sum(scores) - num_train * 1) / num_train  # 去掉每个样本多加的对应label得分,然后平均
    loss += reg * np.sum(W * W)

    # dw = x.T * dl/ds
    ds = np.ones_like(scores)  # 初始化ds
    ds *= mask  # 有效的score梯度为1,无效的为0
    ds[np.arange(num_train), y] = -1 * (np.sum(mask, axis=1) - 1)  # 每个样本对应label的梯度计算了(有效的score次),取负号
    dW = np.dot(X.T, ds) / num_train   # 平均
    dW += 2 * reg * W  # 加上正则项的梯度

    return loss, dW
5.
四、作业/课程问题记录
1.
Inline Question 1:
It is possible that once in a while a dimension in the gradcheck will not match exactly. What could such a discrepancy be caused by? Is it a reason for concern? What is a simple example in one dimension where a gradient check could fail? How would change the margin affect of the frequency of this happening? Hint: the SVM loss function is not strictly speaking differentiable
Your Answer: 有可能数值梯度和实际的梯度是不匹配的,原因是因为 max 函数是非线性的,在 0 处连续但是不可导的,所以算出来的数值梯度是不准确的

在进行梯度验证的时候,尽量避免这些不可微的点
2.
Inline question 2:
Describe what your visualized SVM weights look like, and offer a brief explanation for why they look they way that they do.
Your answer: 可视化 SVM 的权重,可以看到,对于每一类的权重,其基本构成了类别的轮廓,这是因为我们通过 SVM 模型,将图片整体拉成一个向量,然后对每个 pixel 的数值赋予一个权重,最后计算一个得分,优化 loss 实现类别的得分最高,这就使得每一类的图片,在轮廓之内的权重会有更大的值,另外一些区域的权重会有一些比较小的值,这样就形成了可视化的效果。
五、SVM优化
六、SVM运用
参考文献:
https://zhuanlan.zhihu.com/p/20945670?refer=intelligentunit
https://www.jianshu.com/p/ef49a6ab88d5
https://www.jianshu.com/p/6340c6f090e9
https://blog.csdn.net/swj110119/article/details/70792647 梯度求导