部署前提:已经安装好了kubernetes的集群,版本是1.11.1,是用kubeadm部署的。
2台虚拟机:master:172.17.1.36 node1:172.17.1.40
prometheus 是kubernetes 监控,可以监控k8s的核心指标以及自定义指标
起官方地址:https://github.com/kubernetes/kubernetes/tree/release-1.11/cluster/addons/prometheus
第一步:
把官方所有的yaml文件下载下来
for i in alertmanager-configmap.yaml alertmanager-deployment.yaml alertmanager-pvc.yaml alertmanager-service.yaml kube-state-metrics-deployment.yaml kube-state-metrics-rbac.yaml kube-state-metrics-service.yaml node-exporter-ds.yml node-exporter-service.yaml prometheus-configmap.yaml prometheus-rbac.yaml prometheus-service.yaml prometheus-statefulset.yaml ;do wget https://raw.githubusercontent.com/kubernetes/kubernetes/release-1.11/cluster/addons/prometheus/$i;done
里面文件具体分为:alertmanager, kube-state-metrics,node-export,prometheus,4个组件,最好是创建4个文件夹,把对应的yaml文件分类下,好处理

整个prometheus 我安装在一个名称空间,先创建个名称空间prom kubectl create ns prom
最开始安装的是node-export,它的作用是收集节点的数据,被prometheus采集的。
官方提供的node-export的yaml文件都是安装在kube-system的名称空间,所以需要修改下
node-exporter-ds.yml 如下:
apiVersion: extensions/v1beta1
kind: DaemonSet
metadata:
  name: node-exporter
  namespace: prom   #这是修改成prom
  labels:
    k8s-app: node-exporter
    kubernetes.io/cluster-service: "true"
    addonmanager.kubernetes.io/mode: Reconcile
    version: v0.15.2
spec:
  updateStrategy:
    type: OnDelete
  template:
    metadata:
      labels:
        k8s-app: node-exporter
        version: v0.15.2
      annotations:
        scheduler.alpha.kubernetes.io/critical-pod: ''
    spec:
#      priorityClassName: system-node-critical    #这行注释,否则创建会报错,具体的原因我还没擦到
      tolerations:                    #加行master节点的污点容忍度,否则不会再master节点创建pod
      - key: node-role.kubernetes.io/master
      containers:
        - name: prometheus-node-exporter
          image: "prom/node-exporter:v0.15.2"
          imagePullPolicy: "IfNotPresent"
          args:
            - --path.procfs=/host/proc
            - --path.sysfs=/host/sys
          ports:
            - name: metrics
              containerPort: 9100
              hostPort: 9100
          volumeMounts:
            - name: proc
              mountPath: /host/proc
              readOnly:  true
            - name: sys
              mountPath: /host/sys
              readOnly: true
          resources:
            limits:
              cpu: 10m
              memory: 50Mi
            requests:
              cpu: 10m
              memory: 50Mi
      hostNetwork: true
      hostPID: true
      volumes:
        - name: proc
          hostPath:
            path: /proc
        - name: sys
          hostPath:
            path: /sys
node-exporter-service.yaml 文件只要修改名称空间就可以了,kubectl apply -f node-exporter-ds.yml node-exporter-service.yaml


如上,pod 核service创建完成。
第二部:部署prometheus
首先prometheus 需要持久存储数据的,官方给的yaml文件中需要设置一个18G的大小的pv,这里我用的是nfs类型的存储,设置pv大小事20G
再master节点安装nfs:
yum install nfs-utils
vim /etc/exports

创建文件夹 mkdir /data
systemctl start nfs && systemctl enable nfs
注意:node节点要执行 yum install nfs-utils ,否则会出现挂载不上的情况,原因事没有nfs的文件类型
创建pv
apiVersion: v1
kind: PersistentVolume
metadata:
  name: pv01
  namespace: prom
  labels:
    name: pv01
spec:
  nfs:
    path: /data/
    server: 172.17.1.36
  accessModes: ["ReadWriteOnce","ReadWriteMany"]
  capacity:
    storage: 20Gi
kubectl apply -f pro_pv.yaml

这是绑定后的图
安装prometheus 有以下4个文件:

prometheus-configmap.yaml prometheus-rbac.yaml 这2个文件只要修改下名称空间就可以了, prometheus-service.yaml 我添加了type,这样外网可以fangwen
如下:
kind: Service
apiVersion: v1
metadata:
  name: prometheus
  namespace: prom  #这里修改
 labels:
    kubernetes.io/name: "Prometheus"
    kubernetes.io/cluster-service: "true"
    addonmanager.kubernetes.io/mode: Reconcile
spec:
  type: NodePort #添加这type
  ports:
    - name: http
      port: 9090
      protocol: TCP
      targetPort: 9090
  selector:
    k8s-app: prometheus
prometheus-statefulset.yaml
apiVersion: apps/v1
kind: StatefulSet
metadata:
  name: prometheus
  namespace: prom    #这里修改成prom
  labels:
    k8s-app: prometheus
    kubernetes.io/cluster-service: "true"
    addonmanager.kubernetes.io/mode: Reconcile
    version: v2.2.1
spec:
  serviceName: "prometheus"
  replicas: 1
  podManagementPolicy: "Parallel"
  updateStrategy:
   type: "RollingUpdate"
  selector:
    matchLabels:
      k8s-app: prometheus
  template:
    metadata:
      labels:
        k8s-app: prometheus
      annotations:
        scheduler.alpha.kubernetes.io/critical-pod: ''
    spec:
#      priorityClassName: system-cluster-critical #这样注销
      serviceAccountName: prometheus
      initContainers:
      - name: "init-chown-data"
        image: "busybox:latest"
        imagePullPolicy: "IfNotPresent"
        command: ["chown", "-R", "65534:65534", "/data"]
        volumeMounts:
        - name: prometheus-data
          mountPath: /data
          subPath: ""
      containers:
        - name: prometheus-server-configmap-reload
          image: "jimmidyson/configmap-reload:v0.1"
          imagePullPolicy: "IfNotPresent"
          args:
            - --volume-dir=/etc/config
            - --webhook-url=http://localhost:9090/-/reload
          volumeMounts:
            - name: config-volume
              mountPath: /etc/config
              readOnly: true
          resources:
            limits:
              cpu: 10m
              memory: 10Mi
            requests:
              cpu: 10m
              memory: 10Mi

        - name: prometheus-server
          image: "prom/prometheus:v2.2.1"
          imagePullPolicy: "IfNotPresent"
          args:
            - --config.file=/etc/config/prometheus.yml
            - --storage.tsdb.path=/data
            - --web.console.libraries=/etc/prometheus/console_libraries
            - --web.console.templates=/etc/prometheus/consoles
            - --web.enable-lifecycle
          ports:
            - containerPort: 9090
          readinessProbe:
            httpGet:
              path: /-/ready
              port: 9090
            initialDelaySeconds: 30
            timeoutSeconds: 30
          livenessProbe:
            httpGet:
              path: /-/healthy
              port: 9090
            initialDelaySeconds: 30
            timeoutSeconds: 30
          # based on 10 running nodes with 30 pods each
          resources:
            limits:
              cpu: 200m
              memory: 1000Mi
            requests:
              cpu: 200m
              memory: 1000Mi

          volumeMounts:
            - name: config-volume
              mountPath: /etc/config
            - name: prometheus-data
              mountPath: /data
              subPath: ""
      terminationGracePeriodSeconds: 300
      volumes:
        - name: config-volume
          configMap:
            name: prometheus-config
  volumeClaimTemplates:
  - metadata:
      name: prometheus-data
    spec:
      accessModes:
        - ReadWriteOnce
      resources:
        requests:
          storage: "16Gi"
应用这4个文件, kubectl apply -f .
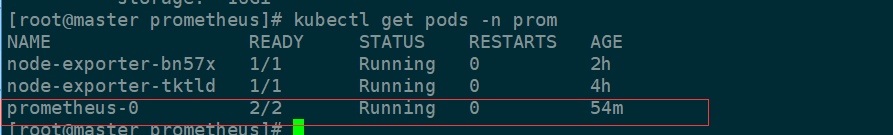

可以外文172.17.1.40:30793来访问prometheus,
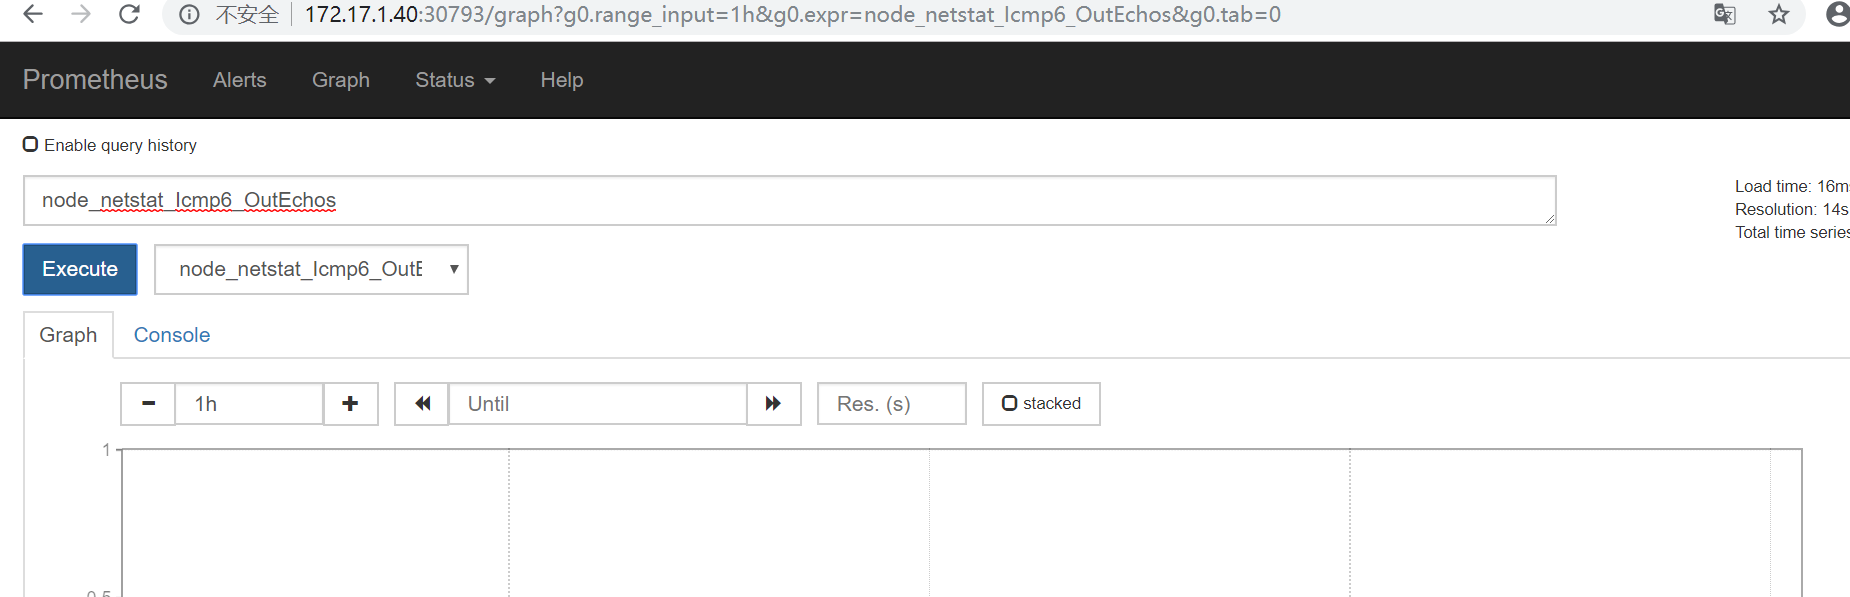
prometheus 本身自己有web 页面,其也有很多生成的查询条件
第三部:部署kube-state-metrics ,这个组件的作用事将prometheus收集的数据,转换成kubernetes 可以设别的数据类型

应用这3个文件。修改的地方是名称空间,kube-state-metrics-deployment.yaml这个文件要注释下面的一行:

查看下pod的状态
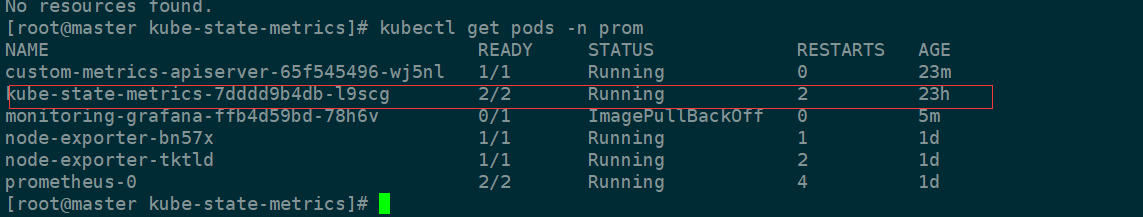
说明安装成功了
第四步:安装prometheus-adapter,这个组件的作用是整合收集的数据到api
github 地址 https://github.com/DirectXMan12/k8s-prometheus-adapter
下载这些文件
需要修改下这些文件的名称空间
应用这个文件之前,需要创建一个secret,文件中有用到这个,并且是kubernetes集群ca证书签署的创建的secret
创建证书:
/etc/kubernetes/pki 在这个目录创建
(umask 077;openssl genrsa -out serving.key 2048) 创建私钥
openssl req -new -key serving.key -out serving.csr -subj "/CN=serving" 生产证书自签请求
openssl x509 -req -in serving.csr -CA ./ca.crt -CAkey ./ca.key -CAcreateserial -out serving.crt -days 3650 生成证书
创建一个secret
kubectl create secret generic cm-adapter-serving-certs --from-file=serving.crt=./serving.crt --from-file=serving.key=./serving.key
应用这些文件 kubectl apply -f .

有这个api说明安装成功了
可以起个代理测试下如下:
kubectl proxy --port=8080
curl http://localhost:8080/apis/custom.metrics.k8s.io/v1beta1
第五步:部署grafana
yaml文件如下:
 1 apiVersion: extensions/v1beta1
 2 kind: Deployment
 3 metadata:
 4   name: monitoring-grafana
 5   namespace: prom
 6 spec:
 7   replicas: 1
 8   template:
 9     metadata:
10       labels:
11         task: monitoring
12         k8s-app: grafana
13     spec:
14       containers:
15       - name: grafana
16         image: k8s.gcr.io/heapster-grafana-amd64:v5.0.4
17         ports:
18         - containerPort: 3000
19           protocol: TCP
20         volumeMounts:
21         - mountPath: /etc/ssl/certs
22           name: ca-certificates
23           readOnly: true
24         - mountPath: /var
25           name: grafana-storage
26         env:
27 #        - name: INFLUXDB_HOST
28 #          value: monitoring-influxdb
29         - name: GF_SERVER_HTTP_PORT
30           value: "3000"
31           # The following env variables are required to make Grafana accessible via
32           # the kubernetes api-server proxy. On production clusters, we recommend
33           # removing these env variables, setup auth for grafana, and expose the grafana
34           # service using a LoadBalancer or a public IP.
35         - name: GF_AUTH_BASIC_ENABLED
36           value: "false"
37         - name: GF_AUTH_ANONYMOUS_ENABLED
38           value: "true"
39         - name: GF_AUTH_ANONYMOUS_ORG_ROLE
40           value: Admin
41         - name: GF_SERVER_ROOT_URL
42           # If you're only using the API Server proxy, set this value instead:
43           # value: /api/v1/namespaces/kube-system/services/monitoring-grafana/proxy
44           value: /
45       volumes:
46       - name: ca-certificates
47         hostPath:
48           path: /etc/ssl/certs
49       - name: grafana-storage
50         emptyDir: {}
51 ---
52 apiVersion: v1
53 kind: Service
54 metadata:
55   labels:
56     # For use as a Cluster add-on (https://github.com/kubernetes/kubernetes/tree/master/cluster/addons)
57     # If you are NOT using this as an addon, you should comment out this line.
58     kubernetes.io/cluster-service: 'true'
59     kubernetes.io/name: monitoring-grafana
60   name: monitoring-grafana
61   namespace: prom
62 spec:
63   type: NodePort
64   # In a production setup, we recommend accessing Grafana through an external Loadbalancer
65   # or through a public IP.
66   # type: LoadBalancer
67   # You could also use NodePort to expose the service at a randomly-generated port
68   # type: NodePort
69   ports:
70   - port: 80
71     targetPort: 3000
72   selector:
73     k8s-app: grafana
需要用到
k8s.gcr.io/heapster-grafana-amd64:v5.0.4 这个镜像,要FQ下
应用grafana 文件

说明安装成功
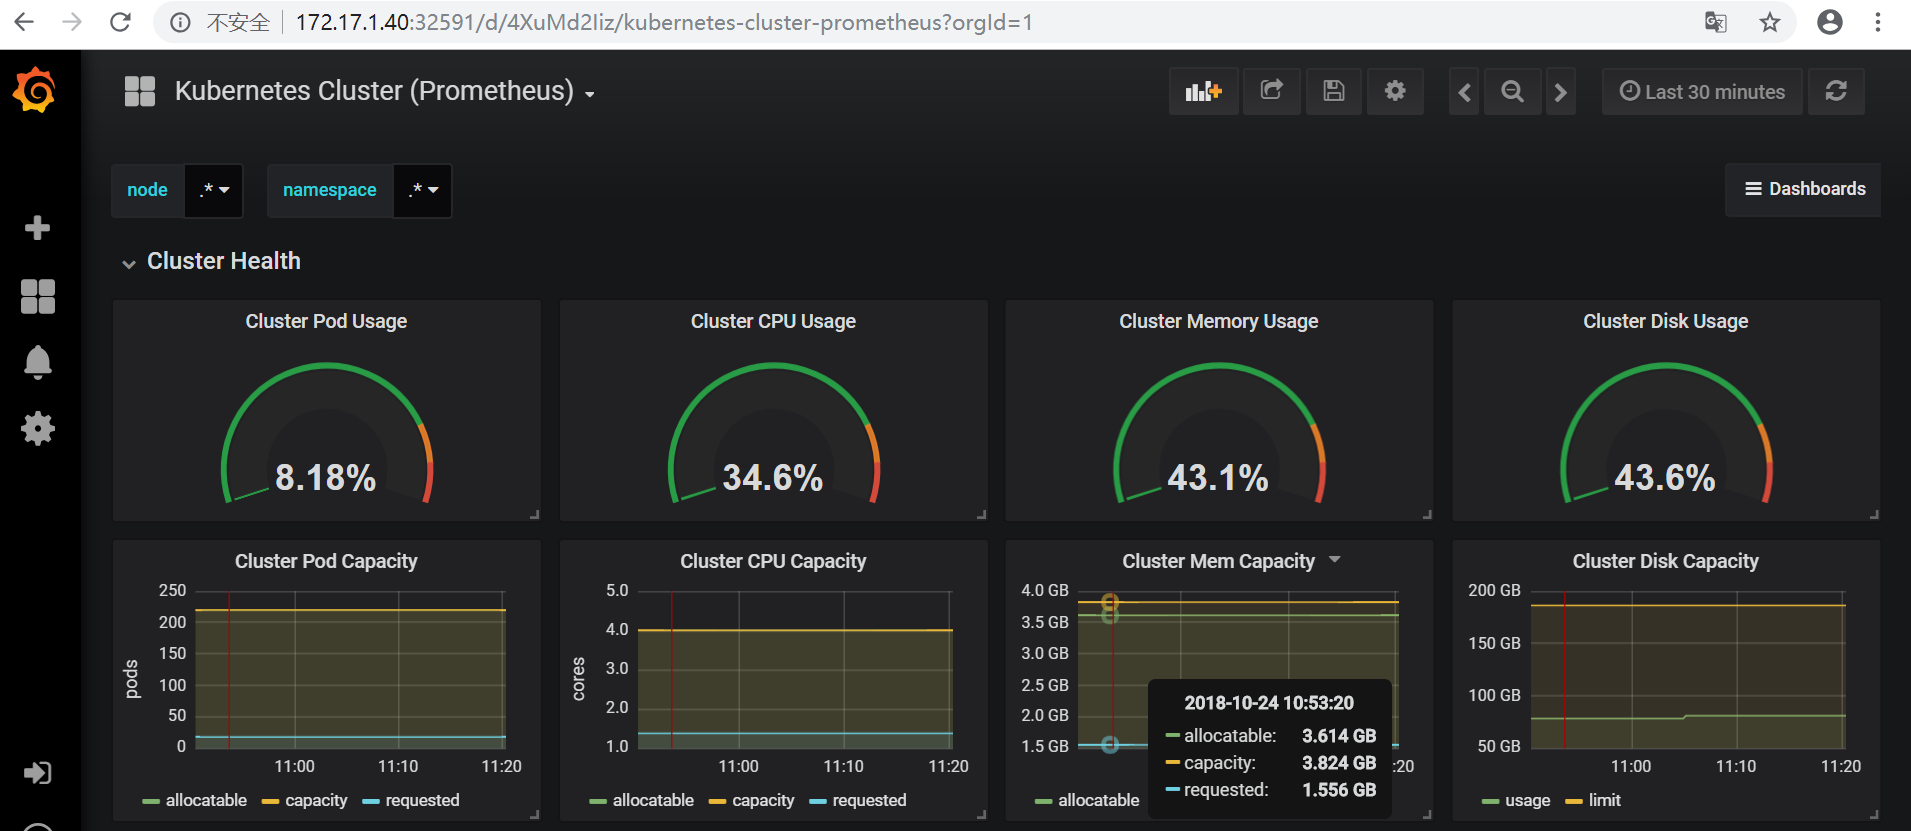
grafana的界面
总结:Prometheus部署步骤有点多,我是安装github的提供的文件安装的,期间遇到各种各样的问题,都吐血了。在出现作错误的时候,首先要看log日志,一般情况都能解决,要么就是版本的问题。以后写个排错的,不然自己长时间也忘了怎么弄。也没仔细排版,以后在整理吧!