Prometheus的部署
Prometheus
- 也是一款监控软件,也是一个时序数据库。
- 主要用在容器监控方面,也可以用于常规的主机监控。
- 使用google公司开发的go语言编写。
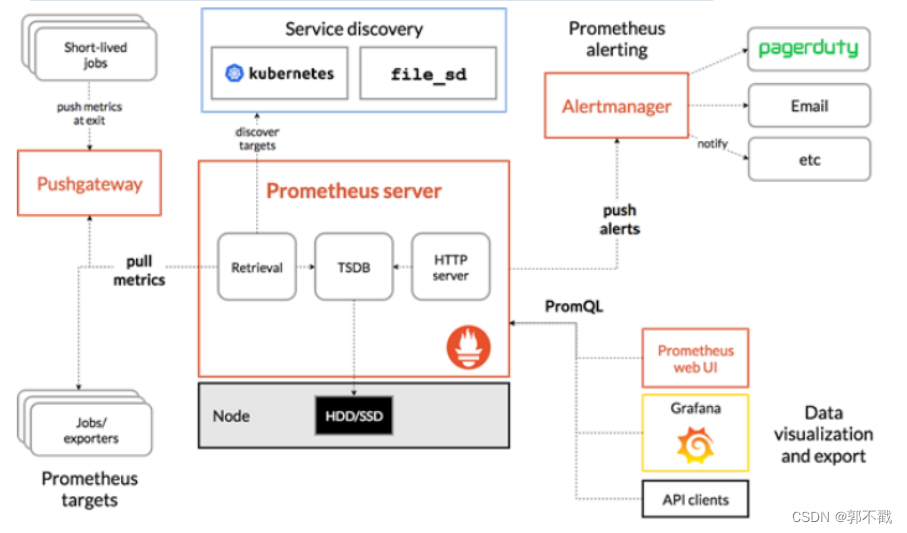
- Prometheus是一个框架,可以与其他组件完美结合。
部署Prometheus服务器
- prometheus:192.168.88.10
- 被控端node1:192.168.88.11
[root@prometheus ~]# tar xf prometheus_soft.tar.gz
[root@prometheus ~]# cd prometheus_soft/

# prometheus是经过编译后的go语言程序,相当于绿色软件,解压即用
[root@prometheus prometheus_soft]# tar xf prometheus-2.17.2.linux-386.tar.gz
[root@prometheus prometheus_soft]# mv prometheus-2.17.2.linux-386 /usr/local/prometheus

# 修改配置文件
[root@prometheus ~]# vim /usr/local/prometheus/prometheus.yml
 29     - targets: ['192.168.88.10:9090']

# 注意:prometheus主机的时间需要与真机时间一致,如果不一致,修改时间
[root@prometheus ~]# timedatectl   # 查看时区
[root@prometheus ~]# timedatectl set-timezone Asia/Shanghai    # 修改时区
[root@prometheus ~]# date -s "20220105 14:18:00"

# 检查语法
[root@prometheus ~]# /usr/local/prometheus/promtool check config /usr/local/prometheus/prometheus.yml
Checking /usr/local/prometheus/prometheus.yml
  SUCCESS: 0 rule files found

# 创建服务文件
[root@prometheus ~]# vim /usr/lib/systemd/system/prometheus.service
[Unit]
Description=Prometheus Monitoring System
After=network.target

[Service]
ExecStart=/usr/local/prometheus/prometheus \
  --config.file=/usr/local/prometheus/prometheus.yml \
  --storage.tsdb.path=/usr/local/prometheus/data/

[Install]
WantedBy=multi-user.target

# 启服务
[root@prometheus ~]# systemctl daemon-reload
[root@prometheus ~]# systemctl enable prometheus.service --now
[root@prometheus ~]# ss -tlnp | grep :9090
LISTEN     0      128         :::9090
查看监控页面
- 访问http://192.168.88.10:9090
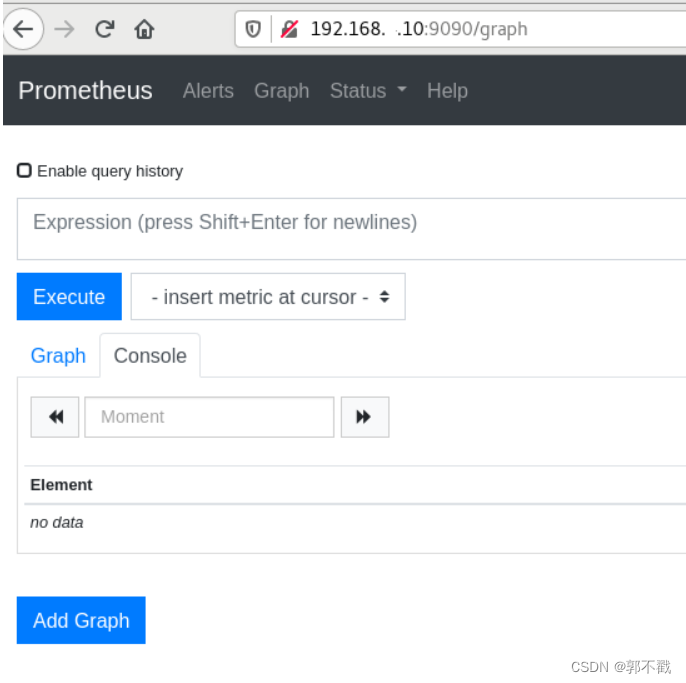
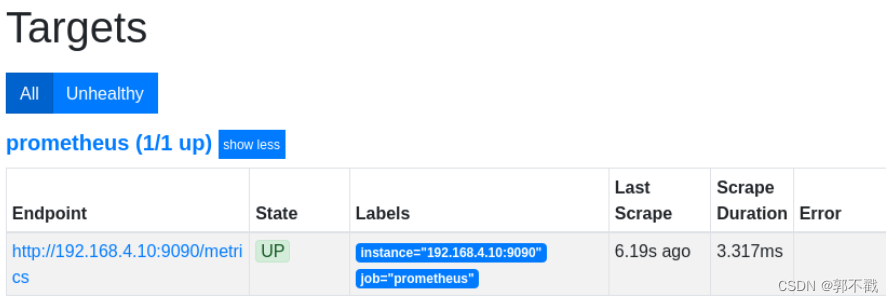
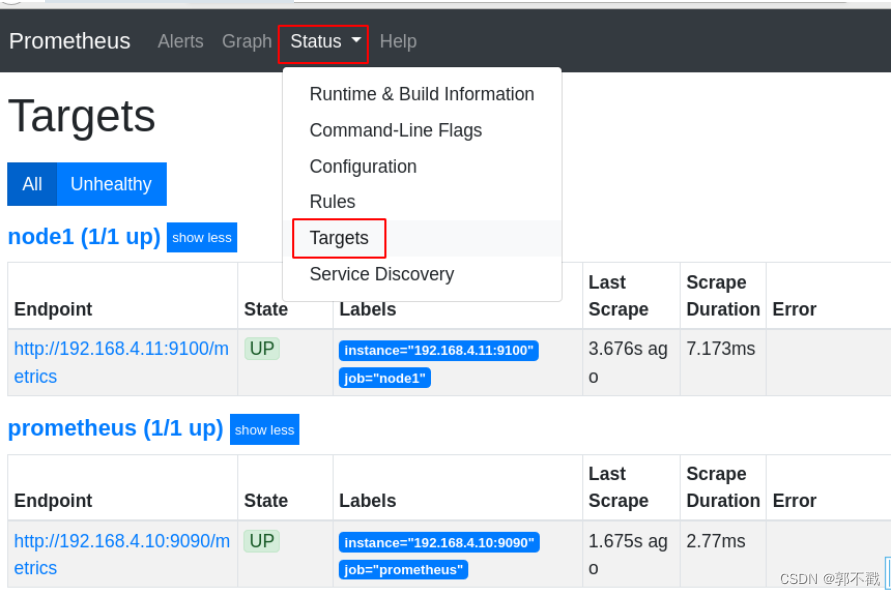
- 被监控的对象称为targets
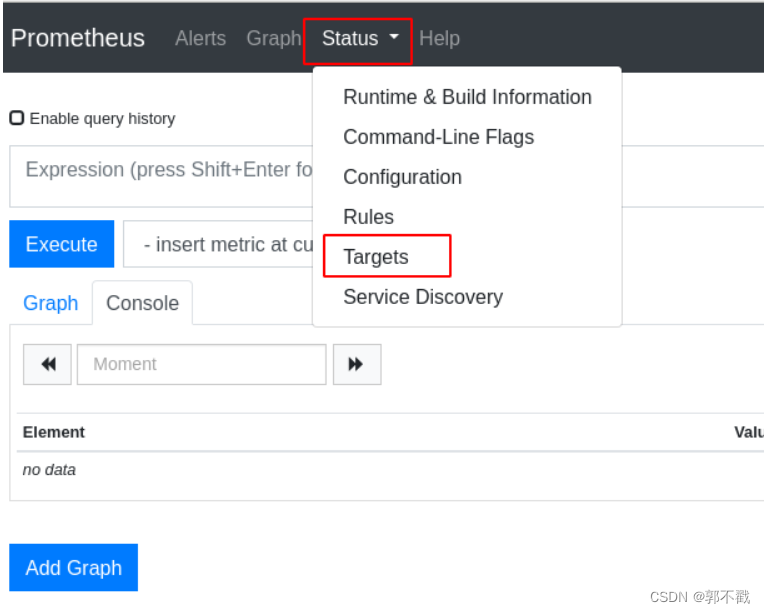
prometheus已经在监控自己了
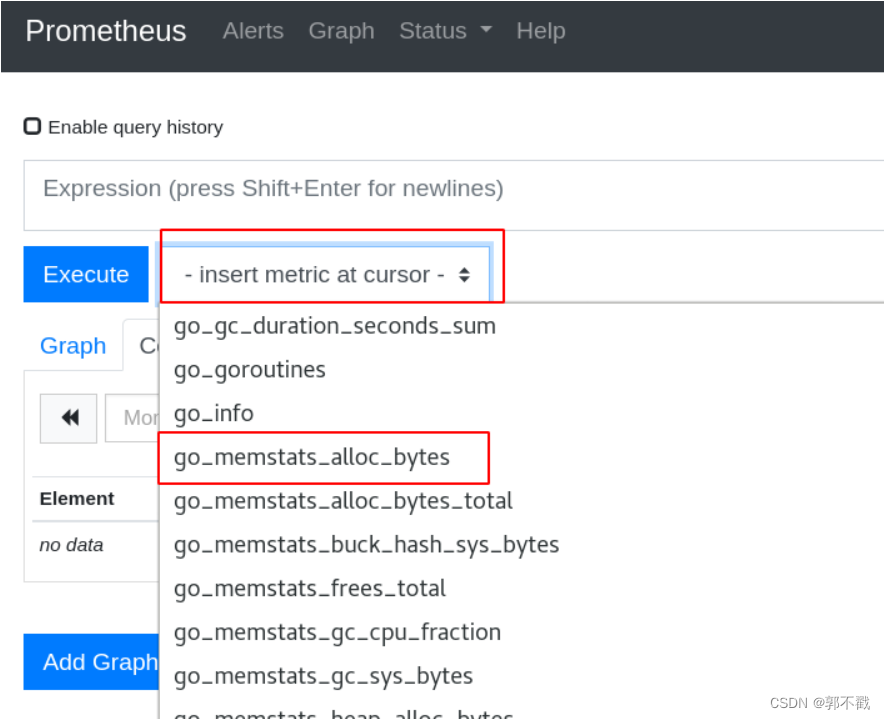
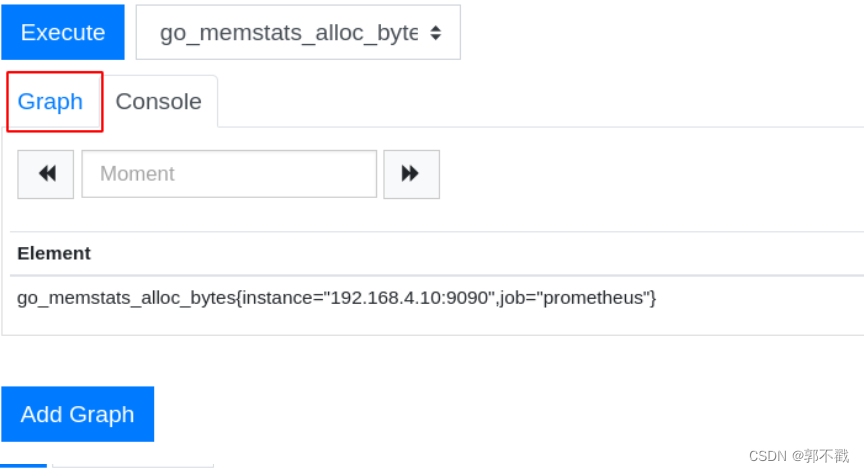
查看监控图像:

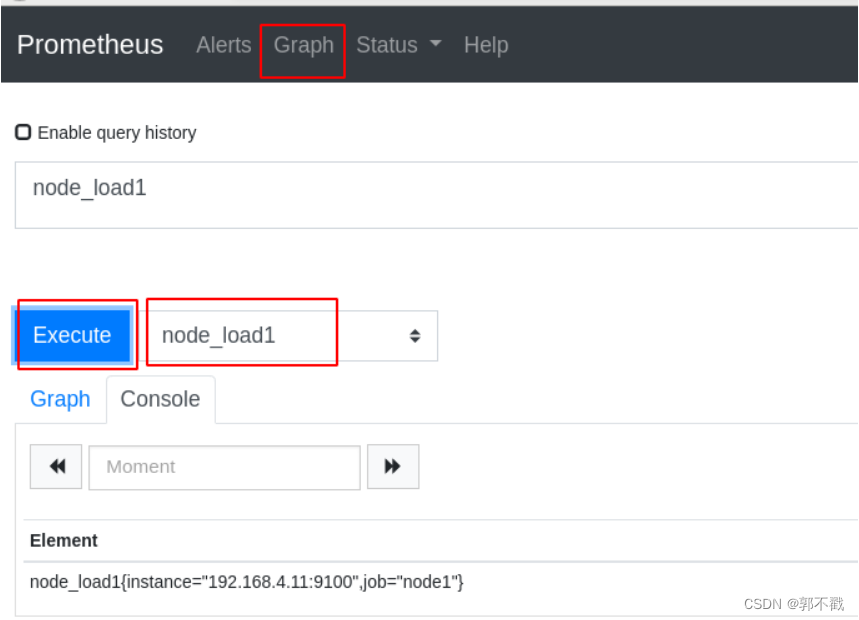
添加需要查看的监控项:
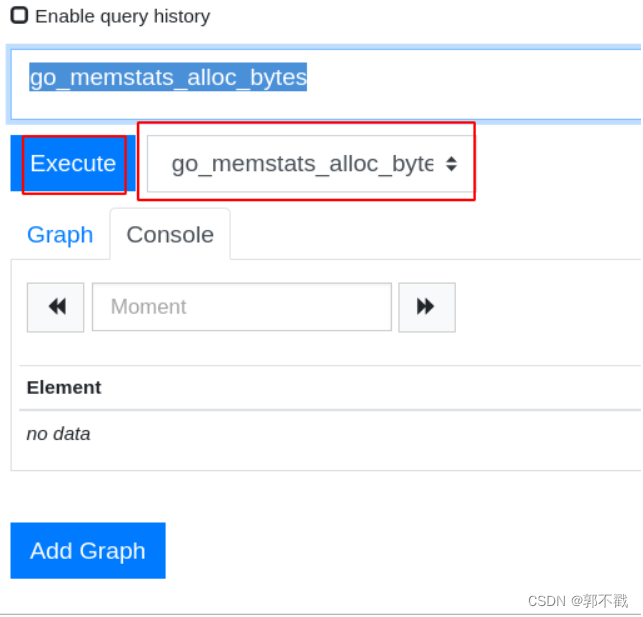
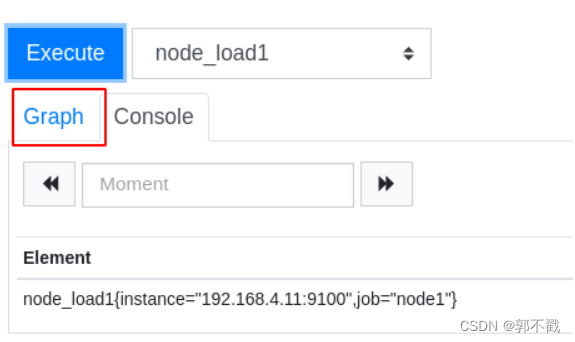
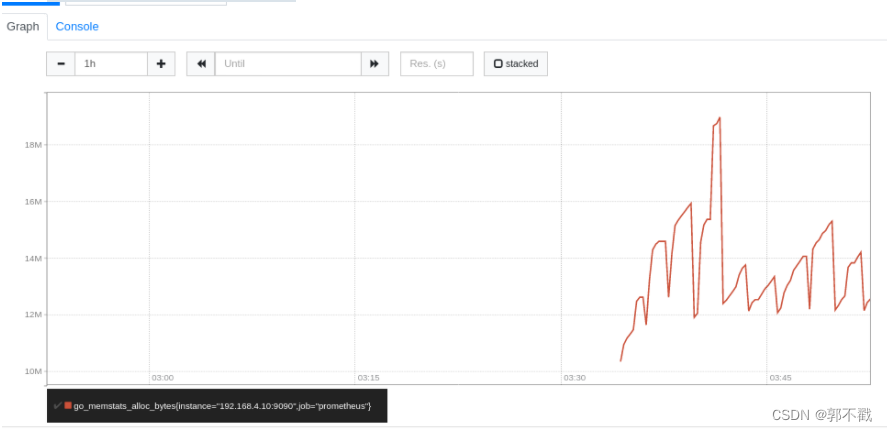
查看监控项的图形信息:
添加被监控端
-
监控方式:
- 拉取:pull。监控端联系被监控端,采集数据
- 推送:push。被监控端主动把数据发给监控端。在prometheus中,push的方式需要额外的组件pushgateway
-
被监控端根据自身运行的服务,可以运行不同的exporter(被监控端安装的、可以与Prometheus通信,实现数据传递的软件)
-
exporter列表:https://prometheus.io/docs/instrumenting/exporters/
部署通用的监控exporter
- node-exporter用于监控硬件和系统的常用指标
- exporter运行于被监控端,以服务的形式存在。每个exporter所使用的端口号都不一样。
- 在node1[192.168.88.11]上部署node exporter
# 部署
[root@prometheus prometheus_soft]# scp node_exporter-1.0.0-rc.0.linux-amd64.tar.gz 192.168.88.11:/root/

[root@node1 ~]# tar xf node_exporter-1.0.0-rc.0.linux-amd64.tar.gz
[root@node1 ~]# mv node_exporter-1.0.0-rc.0.linux-amd64 /usr/local/node_exporter

[root@node1 ~]# vim /usr/lib/systemd/system/node_exporter.service
[Unit]
Description=node_exporter
After=network.target

[Service]
Type=simple
ExecStart=/usr/local/node_exporter/node_exporter

[Install]
WantedBy=multi-user.target

[root@node1 ~]# systemctl daemon-reload
[root@node1 ~]# systemctl enable node_exporter.service --now
[root@node1 ~]# ss -tlnp | grep :9100
LISTEN     0      128         :::9100
- 在Prometheus服务器上添加监控节点
# 在配置文件中追加以下内容。特别注意缩进
[root@prometheus ~]# vim /usr/local/prometheus/prometheus.yml
  - job_name: 'node1'
    static_configs:
    - targets: ['192.168.88.11:9100']
[root@prometheus ~]# systemctl restart prometheus.service
查看结果:
- 查看node1节点的1分钟平均负载