1.prometheus安装
软件下载:
wget https://dl.grafana.com/oss/release/grafana-6.4.2-1.x86_64.rpm
https://github.com/prometheus/prometheus/releases/download/v2.13.0/prometheus-2.13.0.linux-amd64.tar.gz
wget https://golang.org/doc/install?download=go1.13.1.linux-amd64.tar.gz
说明:虚拟机Centos7 环境下进行安装.
1.1环境装备
配置golang的环境
wget https://golang.org/doc/install?download=go1.13.1.linux-amd64.tar.gz
tar -C /usr/local/ -xvf    go1.13.1.linux-amd64.tar.gz
添加到环境变量中
vim /etc/profile
export PATH=$PATH:/usr/local/go/bin
重载环境变量
source /etc/profile
查看版本
go   version
1.2安装Prometheus
tar -C /usr/local/ -xvf   prometheus-2.13.0.linux-amd64.tar.gz
ln -sv /usr/local/prometheus-2.13.0.linux-amd64/   /usr/local/prometheus
启动:
/usr/local/prometheus/prometheus  --storage.tsdb.path=/data/     --config.file=/usr/local/prometheus/prometheus.yml
暂时关闭防火墙
systemctl stop firewalld.service
登录:http://192.168.31.91:9090
1.3安装Grafana
rpm -ivh --nodeps grafana-6.4.2-1.x86_64.rpm
启动:
systemctl daemon-reload
systemctl enable grafana-server.service
systemctl start grafana-server.service
登录:http://192.168.31.91:3000/login  初始密码:admin admin
安装饼图插件:
grafana-cli plugins install grafana-piechart-panel
注意Grafana 密码重置
yum的安装方式,源码安装方式找到grafana.db文件
sqlite3 /var/lib/grafana/grafana.db
update user set password = '59acf18b94d7eb0694c61e60ce44c110c7a683ac6a8f09580d626f90f4a242000746579358d77dd9e570e83fa24faa88a8a6', salt = 'F3FAxVm33R' where login = 'admin';
1.4.配置Grafana
添加prometheus数据源
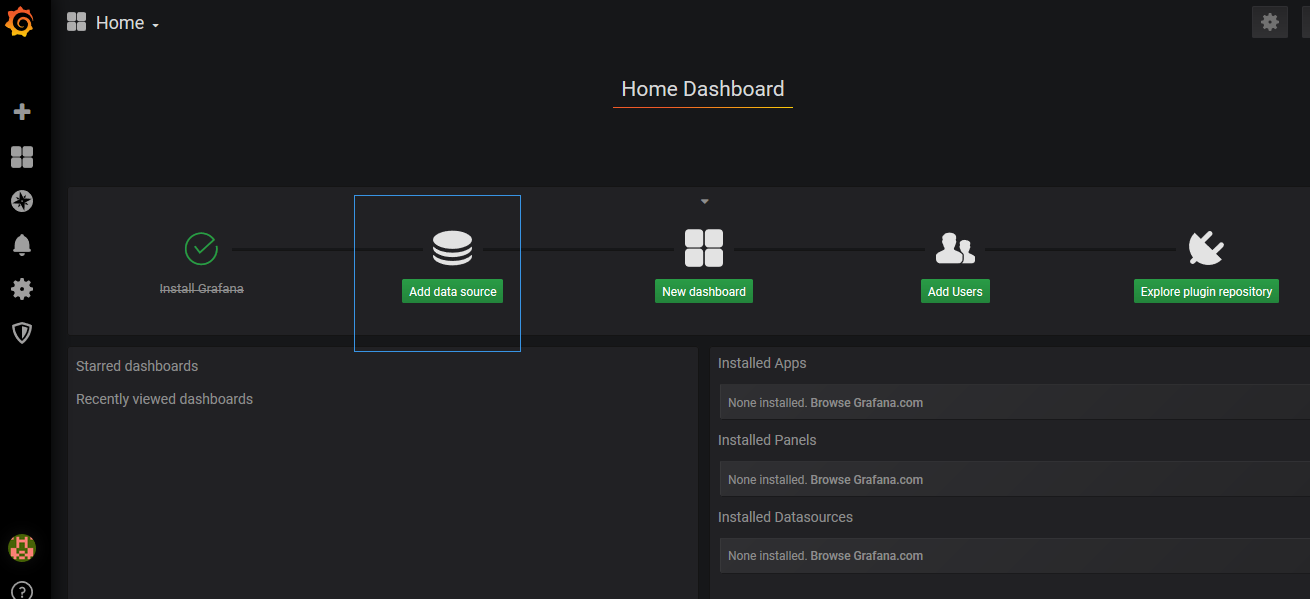
点击主界面的“Add data source”
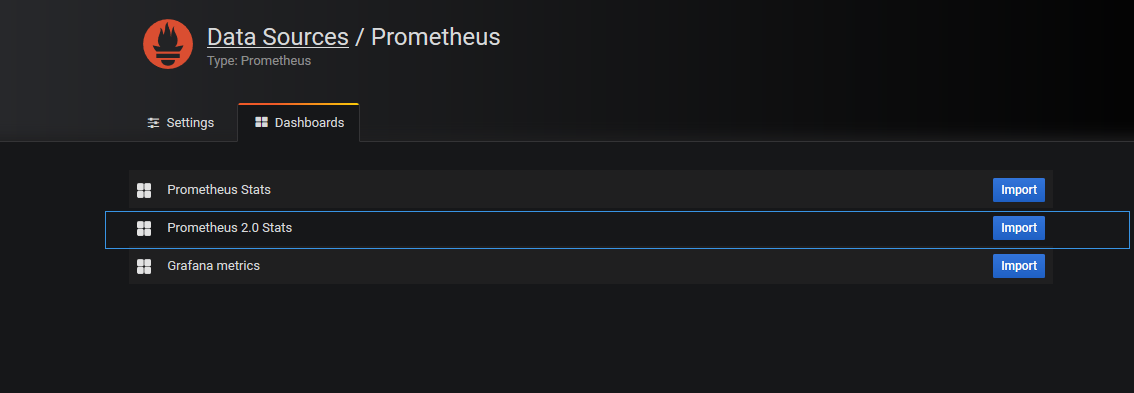
Dashboards页面选择“Prometheus 2.0 Stats”
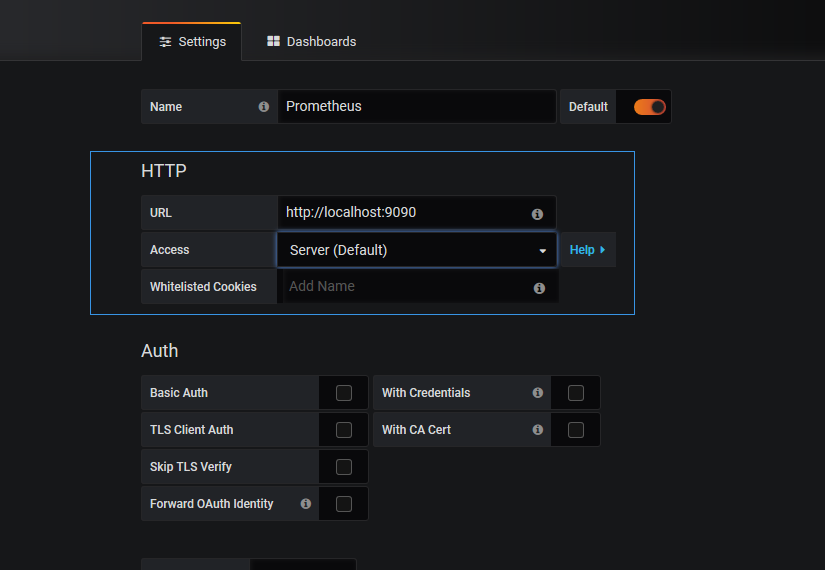
Settings页面填写普罗米修斯地址并保存
如果需要告警的配置需要下载alertmanager
Prometheus的告警机制是server推送告警到alertmanger,配置告警规则和告警方式
插件下载地址https://github.com/prometheus/alertmanager/releases/download/v0.19.0/alertmanager-0.19.0.linux-amd64.tar.gz
具体架构图如下:

如果在prometheus的http://localhost:9090/管理界面没有数据同时又
No datapoints found报错显示
解决方案:一定要修改服务器的时间
***