目录
架构
Prometheus的基本原理是通过HTTP周期性抓取被监控组件的状态,任意组件只要提供对应的HTTP接口并符合Prometheus定义的数据格式,就可以介入Prometheus监控
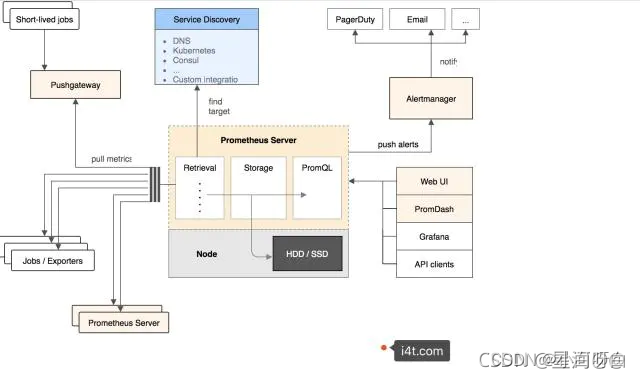
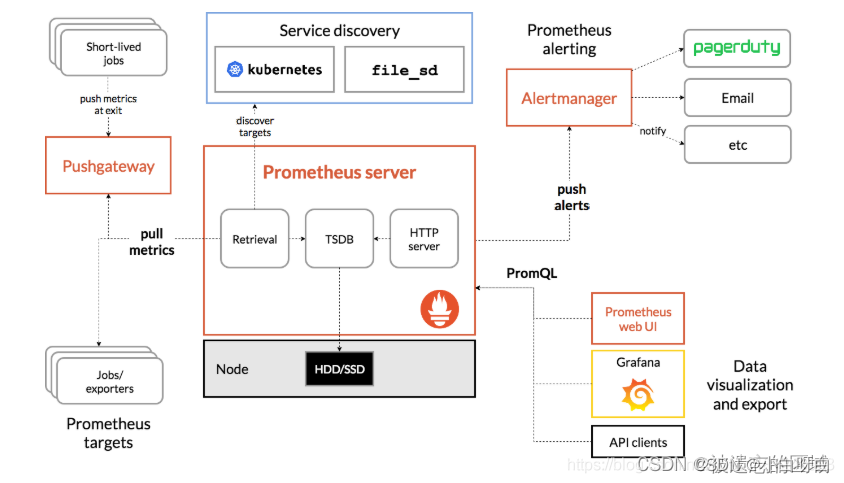
Prometheus Server负载定时在目标上抓取metrics(指标)数据,每个抓取目标都需要暴露一个HTTP服务接口用于Prometheus定时抓取。这种调用被监控对象获取监控数据的方式被称为Pull(拉)。Pull方式体现了Prometheus独特的设计哲学与大多数采用Push(推)方式的监控不同
Pull方式的优势是能够自动进行上游监控和水平监控,配置更少,更容易扩展,更灵活,更容易实现高可用。简单来说就是Pull方式可以降低耦合。由于在推送系统中很容易出现因为向监控系统推送数据失败而导致被监控系统瘫痪的问题。所以通过Pull方式,被采集端无需感知监控系统的存在,完全独立于监控系统之外,这样数据的采集完全由监控系统控制
安装
下载地址:https://prometheus.io/download/
-
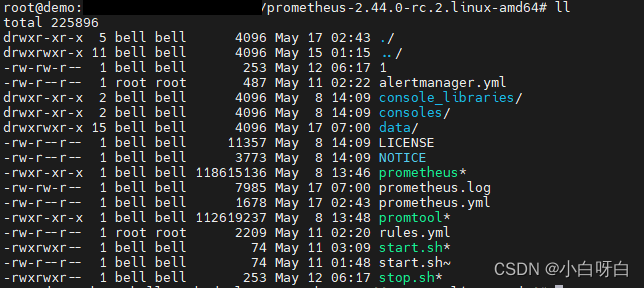
上传到linux服务器,运行命令
tar -zxf prometheus-2.44.0.linux-amd64.tar.gz解压。
-
为了方便操作 我更改了它的端口,并编了
./start.sh和./stop.sh两个脚本方便以后启动,语句如下:vim ./start.sh
nohup ./prometheus --config.file=prometheus.yml > ./prometheus.log 2>&1 &vim ./stop.sh
#!/bin/sh echo "stop" #!/bin/bash PID=$(ps -ef | grep prometheus | grep -v grep | awk '{ print $2 }') if [ "${PID}" ] then echo 'Application is stpping...' echo kill $PID DONE kill $PID else echo 'Application is already stopped...' fi -
输入命令
./start.sh。 -
网址输入
localhost:9090出现如下画面则安装成功~

部署Exporters
-
部署Exporters前需在官网下载部署后再进行,如下提供部分Exporters的地址,按需求自行安装。
node_exporter 官网地址 ------ node_exporter 参考教程
windows_exporter 官网地址 ------ windows_exporter 参考教程
mysqld_exporter 官网地址 ------ mysqld_exporter 参考教程
postgres_exporter 官网地址 ------ postgres_exporter 参考教程
redis_exporter 官网地址 ------ redis_exporter 参考教程 -
在此提供一个
prometheus.yml配置文件,以供参考:
# my global config
global:
  scrape_interval: 15s # Set the scrape interval to every 15 seconds. Default is every 1 minute.
  evaluation_interval: 15s # Evaluate rules every 15 seconds. The default is every 1 minute.
  # scrape_timeout is set to the global default (10s).

# Alertmanager configuration
alerting:
  alertmanagers:
    - static_configs:
      - targets: [xiaobai.com:8887]
          # - alertmanager:9093

# Load rules once and periodically evaluate them according to the global 'evaluation_interval'.
rule_files:
  # - "first_rules.yml"
  # - "second_rules.yml"
  - "rules.yal"
# A scrape configuration containing exactly one endpoint to scrape:
# Here it's Prometheus itself.
scrape_configs:
  # The job name is added as a label `job=<job_name>` to any timeseries scraped from this config.
  - job_name: "prometheus"

    # metrics_path defaults to '/metrics'
    # scheme defaults to 'http'.

    static_configs:
      - targets: ["localhost:9090"]
        #labels:
          #instance: prometheus


  - job_name: mysqld
    static_configs:
      - targets: ['127.0.0.1:13306']
        #labels:
          #instance: mysqld

  - job_name: postgresql
    static_configs:
      - targets: ['127.0.0.1:15432']
        #labels:
          #instance: postgresql

  - job_name: redis
    static_configs:
      - targets: ['127.0.0.1:9121']
        #labels:
          #instance: postgresql

  - job_name: node_self
    static_configs:
      - targets: ['127.0.0.1:9100']

  - job_name: windows_self
    static_configs:
      - targets: ['xiaobai.com:9182']


  - job_name: skywalking_self
    static_configs:
      - targets: ['127.0.0.1:1543']
- 部署成功后重启promethes。
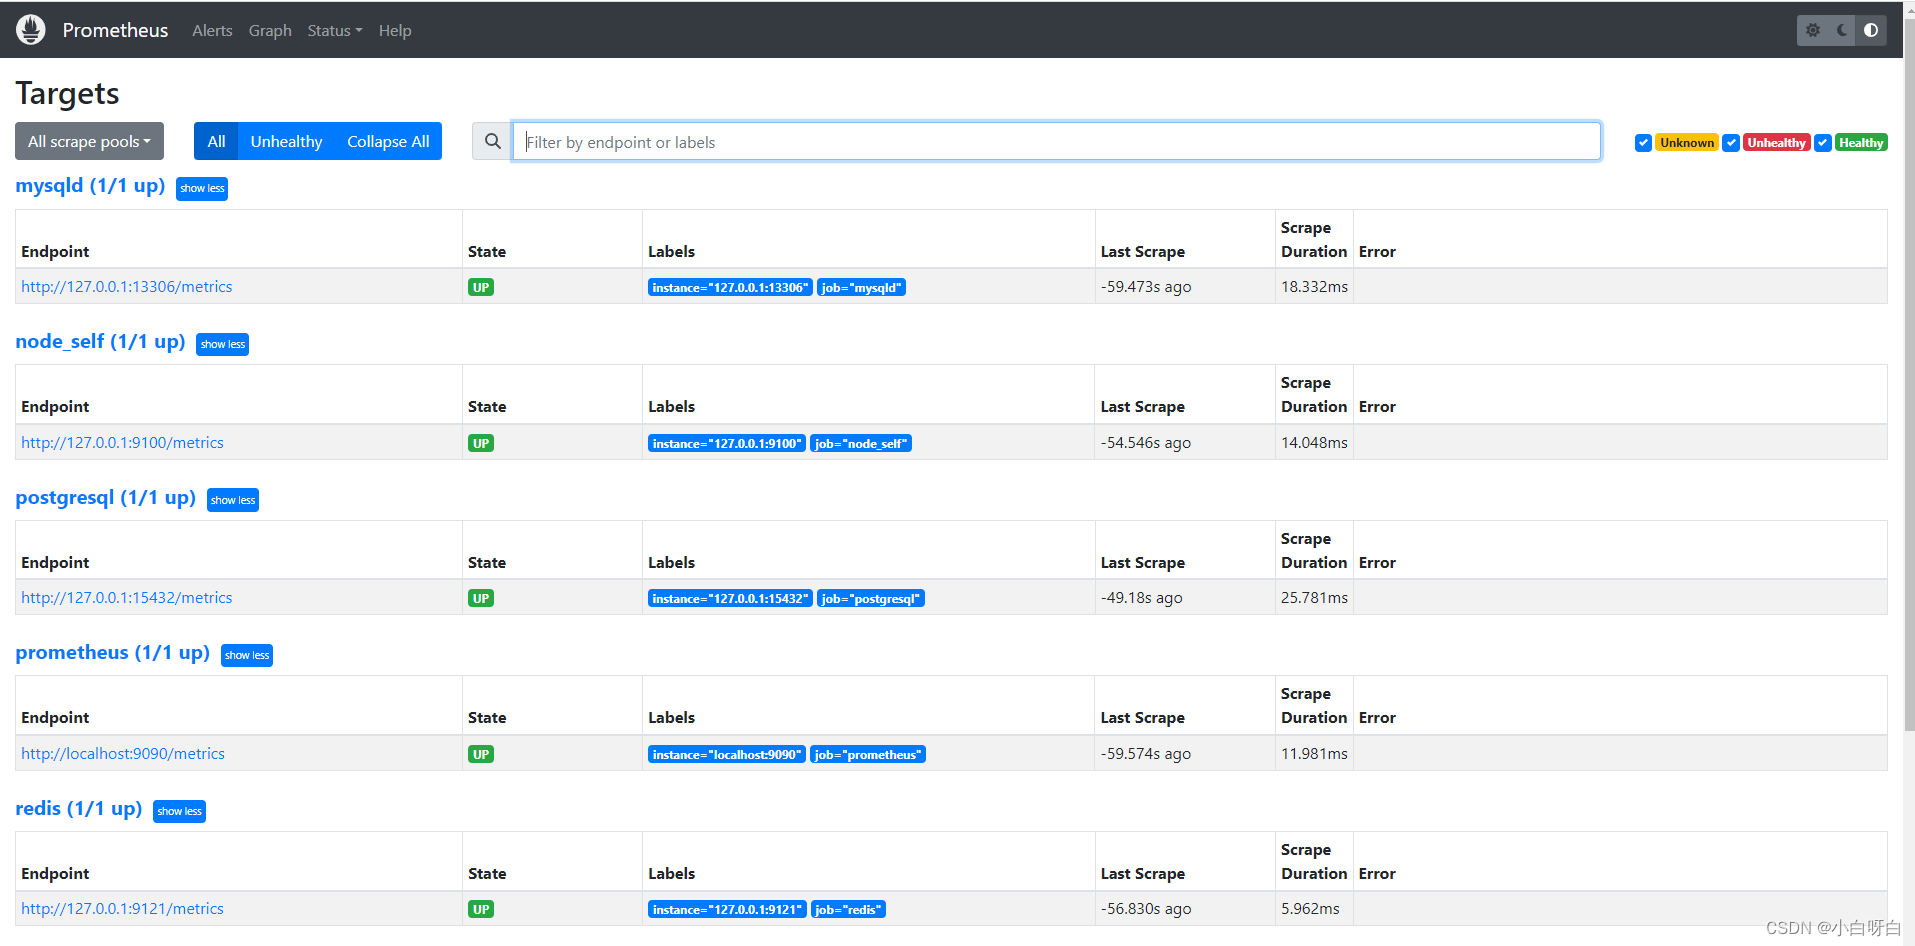
- 在网址内输入
http://localhost:9090/targets,显示下列配置信息即数据监控配置成功~