import matplotlib.pyplot as plt
import numpy as np
from mpl_toolkits.mplot3d import Axes3D
%matplotlib inline
fig = plt.figure()
ax = Axes3D(fig)
x = np.arange(-4,4,0.25)
y = np.arange(-4,4,0.25)
X,Y = np.meshgrid(x,y)
Z = np.sin(np.sqrt(X**2+Y**2))
ax.plot_surface(X, Y, Z, rstride = 1, cstride = 1, cmap = 'rainbow')
ax.contour(X,Y,Z,zdim='z',offset = -2 ,cmap='rainbow')
ax.set_zlim(-2,2)
(-2, 2)

#空白三维图
fig = plt.figure()
ax = fig.add_subplot(111,projection = '3d')
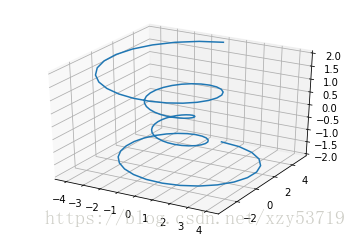
fig = plt.figure()
ax = fig.gca(projection='3d')

theta = np.linspace(-4 * np.pi, 4 * np.pi, 100)
z = np.linspace(-2,2,100)
r = z**2 + 1
x = r * np.sin(theta)
y = r * np.cos(theta)
ax.plot(x,y,z)
[<mpl_toolkits.mplot3d.art3d.Line3D at 0x2222a944b70>]
#3维散点图
np.random.seed(101)
def randrange(n,vmin,vmax):
    return (vmax-vmin) * np.random.rand(n) + vmin
fig = plt.figure()
ax = fig.add_subplot(111,projection='3d')
n = 100
for c, m, zlow, zhigh in [('r', 'o', -50, -25), ('b', 'x', -30 ,-5)]:
    xs = randrange(n, 23,32)
    ys = randrange(n,0,100)
    zs = randrange(n, zlow, zhigh)
    ax.scatter(xs,ys,zs,color = c, marker = m)

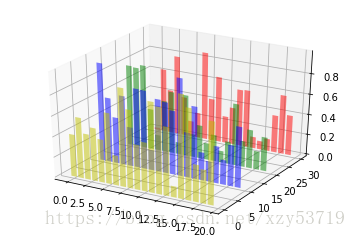
#三维条形图
fig = plt.figure()
ax = fig.add_subplot(111,projection='3d')
for c, z in zip(['r', 'g', 'b', 'y'], [30, 20, 10, 0]):
    xs = np.arange(20)
    ys = np.random.rand(20)
    cs = [c]*len(xs)
    ax.bar(xs,ys,zs = z,zdir='y',color = cs,alpha = 0.5)