#coding=utf-8
import numpy as np
import matplotlib.pyplot as plt
from mpl_toolkits.mplot3d import Axes3D
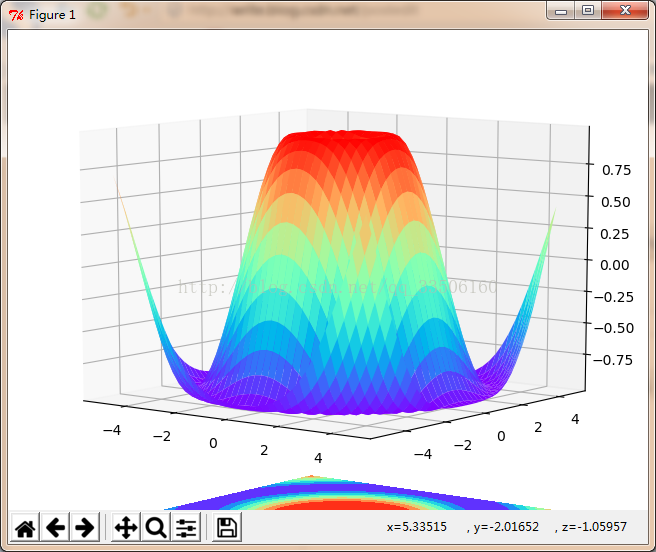
fig=plt.figure()
ax=Axes3D(fig)
x=np.arange(-5,5,0.25)
y=np.arange(-5,5,0.25)
x,y=np.meshgrid(x,y)
r=np.sqrt(x**2+y**2)
z=np.sin(r)
#高度
ax.plot_surface(x,y,z,rstride=1,cstride=1,cmap=plt.get_cmap('rainbow'))
#填充rainbow颜色
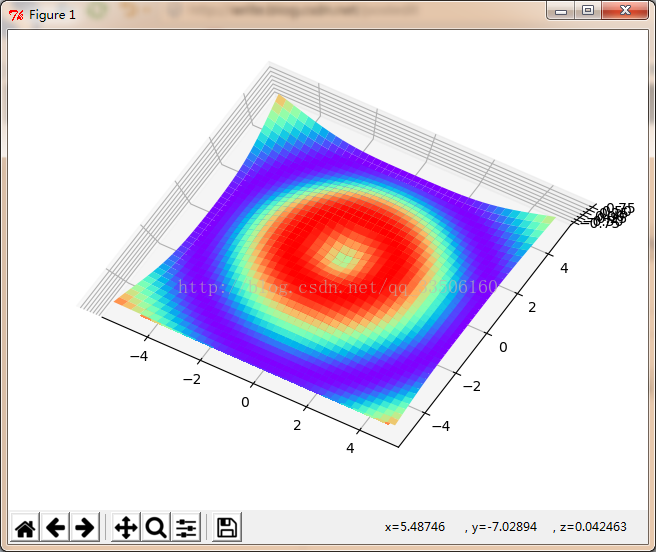
ax.contourf(x,y,z,zdir='z',offset=-2,cmap='rainbow')
#绘制3D图形,zdir表示从哪个坐标轴上压下去
plt.show()
#显示图片