齐次坐标系描述了刚体的坐标系、位置,而且还提供了一套相对旋转、相对移动、绝对旋转、绝对移动的方法,用来绘制旋转的 3D 立体是再好不过的选择
齐次坐标系
将笛卡尔坐标系的三个轴记为 ,将任意的齐次坐标系记为

我们使用这样一个矩阵来描述 坐标系与
坐标系之间的关系:
其中 表示
坐标系的原点在
坐标系中的绝对位置,
表示 n 轴在
坐标系中的方向向量 (且为单位向量),o 轴和 a 轴同理
此外,我们可以通过齐次变换矩阵完成对齐次坐标系的变换,齐次变换矩阵包括旋转矩阵 ()、平移矩阵 (
):
以旋转矩阵 为例,
表示
坐标系绕 x 轴旋转 (即绝对变换),
表示
坐标系绕 n 轴旋转 (即相对变换)
通常在绘图时,我们需要关注的是各个图形的各个组件之间的相对位置关系 (比如机械臂:https://hebitzj.blog.csdn.net/article/details/123810092),齐次变换矩阵提供齐次坐标系变换方法显然可以满足我们的需求
图形变换原理
在已知齐次坐标系 的情况下,怎样在该坐标系上绘制图形?
中的子阵
描述了
三轴在
坐标系上的分量,比如:
描述了 n 轴在 x 轴上的分量,
描述了 o 轴在 x 轴上的分量,
描述了 a 轴在 x 轴上的分量
如果给定 坐标系下的点
,那么其在
坐标系下的 x 坐标为:
该点的 y,z 坐标也同理,那么有以下变换将点 将
坐标转换为
坐标:
matplotlib 中的 plot_surface 和 voxels,其形参都是三维空间中的点集
我们可以先在坐标原点处绘制图形 (看成在 坐标系里面画),然后在给定齐次坐标系
所对应的矩阵后,利用上述方程求解出该图形的各个点在
坐标系中的坐标
当然,这个结论也可以推广到二维的齐次坐标系
核心代码
为了实现 matplotlib 绘图和齐次坐标系的无缝衔接,我编写了 CoordSys_3d 这个类,其中的各个类方法的功能如下:
- trans:给定 xyz 轴上的偏移量,生成平移变换矩阵
- rot:给定旋转角、转轴,生成旋转变换矩阵
- abs_tf:输入由 trans、rot 生成的变换矩阵,执行绝对变换
- rela_tf:输入由 trans、rot 生成的变换矩阵,执行相对变换
- apply:给定描述曲面 / 立体的 xyz 矩阵,根据齐次坐标系矩阵对该曲面 / 立体进行平移和旋转
from typing import Union

import matplotlib.pyplot as plt
import numpy as np


class _CoordSys_nd:
    dtype = np.float16
    dim = None
    # 位置, 各个轴的方向向量
    position = property(fget=lambda self: self.s[:self.dim, -1])
    direction = property(fget=lambda self: self.s[:self.dim, :self.dim])

    def __init__(self, state: np.ndarray = None):
        size = self.dim + 1
        self.s = np.eye(size, dtype=self.dtype)
        # 使用非空形参
        if isinstance(state, np.ndarray):
            assert state.shape == self.s.shape
            self.s = state

    def abs_tf(self, tf):
        ''' 绝对变换'''
        return type(self)(tf @ self.s)

    def rela_tf(self, tf):
        ''' 相对变换'''
        return type(self)(self.s @ tf)

    def apply(self, *coords) -> tuple:
        ''' 局部坐标值 -> 全局坐标值'''
        xyz = np.stack(coords, axis=-1) @ self.direction.T + self.position
        return tuple(i[..., 0] for i in np.split(xyz, self.dim, axis=-1))

    def plot_coord_sys(self, length=.5, linewidth=None,
                       colors=['orangered', 'deepskyblue', 'greenyellow'], labels='xyz'):
        ''' 绘制局部坐标系'''
        pos = self.position
        axis = self.direction.T * length
        for i in range(self.dim):
            plt.plot(*zip(pos, pos + axis[i]), c=colors[i], label=labels[i], linewidth=linewidth)

    def __str__(self):
        return str(self.s) + '\n'

    __repr__ = __str__


class CoordSys_2d(_CoordSys_nd):
    dim = 2

    def apply(self, x: np.ndarray, y: np.ndarray) -> tuple:
        ''' 局部坐标值 -> 全局坐标值'''
        return super().apply(x, y)

    def transform(self, dx: float = 0., dy: float = 0.,
                  theta: float = 0, relative: bool = True):
        ''' dx,dy: 平移变换的参数
            theta: 旋转变换的参数
            relative: 是否使用相对变换'''
        # 绕 z 轴旋转, 并平移
        mat = np.concatenate((np.eye(3, 2, dtype=self.dtype),
                              np.array((dx, dy, 1))[:, None]), axis=-1)
        if theta:
            theta = np.deg2rad(theta)
            cos, sin = np.cos(theta), np.sin(theta)
            mat[:2, :2] = np.array([[cos, -sin], [sin, cos]])
        return (self.rela_tf if relative else self.abs_tf)(mat)


class CoordSys_3d(_CoordSys_nd):
    dim = 3

    def apply(self, x: np.ndarray, y: np.ndarray, z: np.ndarray) -> tuple:
        ''' 局部坐标值 -> 全局坐标值'''
        return super().apply(x, y, z)

    @classmethod
    def trans(cls, dx: float = 0., dy: float = 0., dz: float = 0.) -> np.ndarray:
        ''' 齐次变换矩阵: 平移'''
        return np.concatenate((np.eye(4, 3, dtype=cls.dtype),
                               np.array((dx, dy, dz, 1))[:, None]), axis=-1)

    @classmethod
    def rot(cls, theta: float, axis: Union[int, str]) -> np.ndarray:
        ''' 齐次变换矩阵: 旋转'''
        mat, theta = np.eye(4, dtype=cls.dtype), np.deg2rad(theta)
        cos, sin = np.cos(theta), np.sin(theta)
        axis = 'xyz'.index(axis) if isinstance(axis, str) else axis
        if axis == 0:
            mat[1: 3, 1: 3] = np.array([[cos, -sin], [sin, cos]])
        elif axis == 1:
            mat[:3, :3] = np.array([[cos, 0, sin], [0, 1, 0], [-sin, 0, cos]])
        elif axis == 2:
            mat[:2, :2] = np.array([[cos, -sin], [sin, cos]])
        else:
            raise AssertionError(f'axis {axis} is out of bounds for 3 dimensions')
        return mat


if __name__ == '__main__':
    rot = CoordSys_3d.rot
    trans = CoordSys_3d.trans

    state = CoordSys_3d()
    # 相对变换
    state = state.rela_tf(rot(30, 'y'))
    print(state)
    # 绝对变换
    state = state.abs_tf(trans(dx=2, dy=3, dz=4))
    print(state)
接下来定义两个函数分别绘制曲面和立体,验证我们的方法:
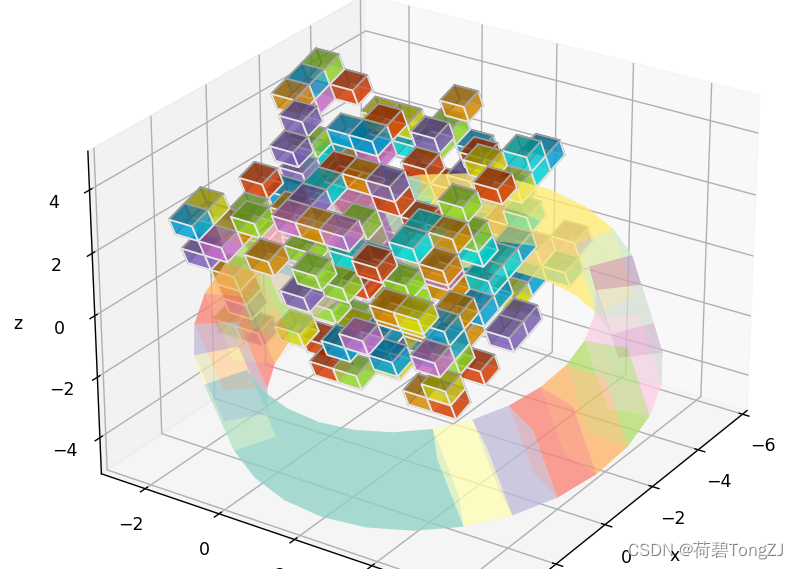
- cylinder:绘制空心圆柱,由内外曲面、上下底面构成,将 4 次调用 plot_surface 函数进行绘制;初始状态下,该空心圆柱的主轴、两底面的法向量均为 z 轴
- rubik_cube:绘制空心魔方,由若干个正方体构成,将调用 1 次 voxels 函数进行绘制
这两个函数的共性在于,先以原点为中心 (这个很重要,效果符合期望后可微调) 生成描述曲面、立体的 xyz 矩阵,然后再利用 CoordTF 对象的 apply 函数对 xyz 矩阵进行变换,完成对 3D 图像的平移、旋转操作
import matplotlib.pyplot as plt
import numpy as np

from coord import CoordSys_3d

red = 'orangered'
orange = 'orange'
yellow = 'yellow'
green = 'greenyellow'
cyan = 'aqua'
blue = 'deepskyblue'
purple = 'mediumpurple'
pink = 'violet'

ROUND_EDGE = 30  # 圆等效多边形边数
DTYPE = np.float16  # 矩阵使用的数据类型


def figure3d():
    ''' 创建3d工作站'''
    figure = plt.subplot(projection='3d')
    tuple(getattr(figure, f'set_{i}label')(i) for i in 'xyz')
    return figure


def cylinder(figure, state: CoordSys_3d,
             R: float, h: float, r: float = 0,
             smooth: int = 2, **plot_kwd):
    ''' 以 state 的 z 轴为主轴绘制圆柱
        figure: 3D 工作站对象
        state: CoordSys_3d 齐次变换矩阵
        R: 圆柱底面外径
        r: 圆柱底面内径
        h: 圆柱高度
        smooth: 图像细致程度 (至少 2)'''
    theta = np.linspace(0, 2 * np.pi, ROUND_EDGE, dtype=DTYPE)
    z = np.linspace(-h / 2, h / 2, smooth, dtype=DTYPE)
    theta, z = np.meshgrid(theta, z)
    # 绘制圆柱内外曲面: 以 z 轴为主轴, 原点为中心
    x, y = np.cos(theta), np.sin(theta)
    figure.plot_surface(*state.apply(x * R, y * R, z), **plot_kwd)
    figure.plot_surface(*state.apply(x * r, y * r, z), **plot_kwd)

    phi = np.linspace(0, 2 * np.pi, ROUND_EDGE, dtype=DTYPE)
    radius = np.linspace(r, R, 2, dtype=DTYPE)
    phi, radius = np.meshgrid(phi, radius)
    # 绘制上下两底面: 法向量为 z 轴, 原点为中心, 在 z 轴上偏移得到两底面
    x, y = np.cos(phi) * radius, np.sin(phi) * radius
    z = np.zeros_like(x)
    for dz in (-h / 2, h / 2):
        s = state.rela_tf(CoordSys_3d.trans(dz=dz))
        figure.plot_surface(*s.apply(x, y, z), **plot_kwd)


def rubik_cube(figure, state: CoordSys_3d,
               length: float, hollow: float = 0.7, smooth: int = 10,
               colors: list = [red, orange, yellow, green, cyan, blue, purple, pink], **plot_kwd):
    ''' 绘制魔方
        length: 边长
        smooth: 魔方的细粒度'''
    x = np.linspace(-length / 2, length / 2, smooth + 1)
    filled = np.random.random([smooth] * 3) > hollow
    color = np.random.choice(colors, size=filled.shape)
    # 绘制各个通道
    figure.voxels(*state.apply(*np.meshgrid(x, x, x)), filled=filled,
                  facecolors=color, edgecolors='white', **plot_kwd)
    return figure


if __name__ == '__main__':
    plt.rcParams['figure.figsize'] = [6.4, 6.4]

    fig = figure3d()
    fig.set_xlim((-6, 4))
    fig.set_ylim((-3, 7))
    fig.set_zlim((-5, 5))

    rot = CoordSys_3d.rot
    trans = CoordSys_3d.trans

    # 绕 y 轴相对旋转 20°, 再绝对平移
    state = CoordSys_3d().rela_tf(rot(20, 'y')).abs_tf(trans(dx=-1, dy=2, dz=-2))
    print(state)
    # 以 z 轴为主轴, 绘制空心圆柱
    cylinder(fig, state=state, R=5, r=4, h=3, cmap='Set3', alpha=0.5)
    # 绘制局部坐标系
    state.plot_coord_sys(length=10, linewidth=5), plt.legend()

    # 在空心圆柱的 z 轴上平移
    state = state.rela_tf(trans(dz=5))
    print(state)
    # 绘制空心魔方
    rubik_cube(fig, state=state, length=6, hollow=0.8, smooth=10, alpha=0.6)
    plt.show()
最终的绘制效果如上图所示,结束