思路介绍:
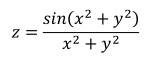
下面我们将使用matplotlib绘制Sinc函数:
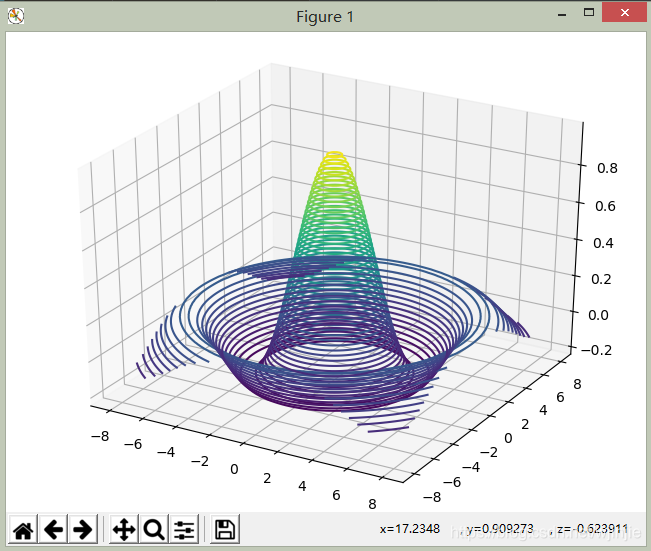
1.首先确定绘制的区间,自变量范围x属于[-8, 8],y属于[-8, 8]。因此要先生成x,y的网格点坐标{(x, y)}
2.通过matplotlib绘制在区间上的函数3D曲面
3.显示出来
先展示3D效果:
程序清单:
import tensorflow as tf
import matplotlib.pyplot as plt
from mpl_toolkits.mplot3d import Axes3D

x = tf.linspace(-8., 8, 100)  # 设置x的坐标间隔
y = tf.linspace(-8., 8, 100)  # 设置x的坐标间隔
x, y = tf.meshgrid(x, y)  # 生成网格点,并拆分后返回
z = tf.sqrt(x**2 + y**2)
z = tf.sin(z)/z  # sinc函数实现

fig = plt.figure()
ax = Axes3D(fig)
# 根据网格点绘制sinc函数3D曲线
ax.contour3D(x.numpy(), y.numpy(), z.numpy(), 50)
plt.show()
