原文:https://www.datacamp.com/community/tutorials/matplotlib-3d-volumetric-data
在这篇Python教程中,您将使用Matplotlib的事件处理程序API来显示MRI数据集的切片。
大多数人都熟悉用普通相机拍摄的图像数据(这些通常在科学文献中被称为“自然图像”),而且还用于显微镜或望远镜等专业仪器。在Python中处理图像时,最常见的显示方式是使用Python最流行的绘图库Matplotlib的imshow函数。
在本教程中,我们将向您展示如何扩展此功能以显示3D体数据,您可以将其视为一堆图像。他们一起描述了一个3D结构。例如,磁共振成像(MRI)和计算机断层扫描(CT)扫描测量人体内的三维结构; X射线显微摄影术测量玻璃或金属合金等材料内部的3D结构; 并且光学显微镜测量生物组织内的荧光颗粒。
我们将演示如何下载MRI数据集并使用显示切片matplotlib。你会学到如何
- 在
nibabel库的帮助下获取您的数据,该图书馆为使用NIfTI文件格式的文件提供阅读器。对于那些想要跳过这一步并直接开始绘图的人,本教程将向您展示如何使用scikit-image获取数据。 - 接下来,您将采用matplotlib的事件处理程序API和功能向功能齐全的切片查看器迈出第一步
- 您将重写一些代码以使用您的新工具。
- 最后,你会看到你完成后如何清理你的工作区。
但首先,让我们回顾一些基础知识:如何使用Matplotlib显示图像imshow。
如果您使用Jupyter Notebook,则可以从启用交互式matplotlib模式开始:
%matplotlib notebook现在您可以导入
matplotlib
并显示一些数据。您将加载scikit-image库的数据模块中包含的一些示例数据:
import matplotlib.pyplot as plt
from skimage import data
astronaut = data.astronaut()
ihc = data.immunohistochemistry()
hubble = data.hubble_deep_field()
# Initialize the subplot panels side by side
fig, ax = plt.subplots(nrows=1, ncols=3)
# Show an image in each subplot
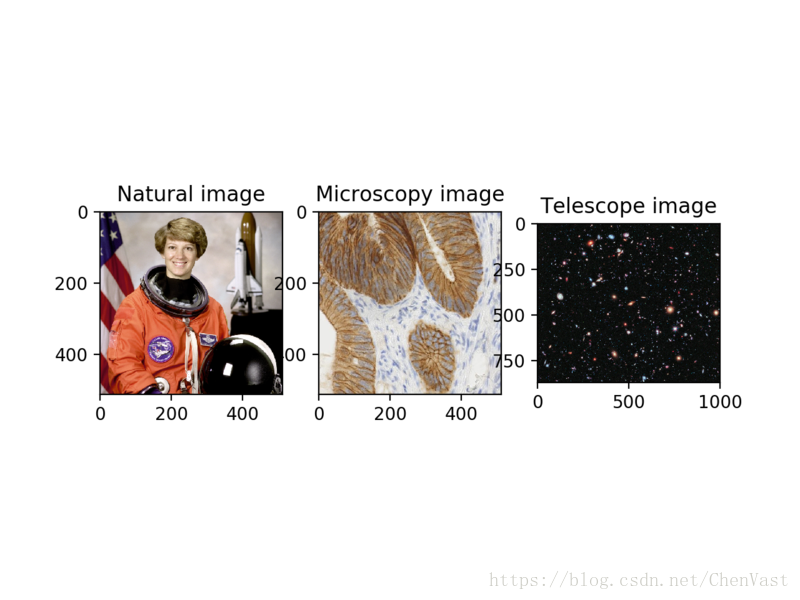
ax[0].imshow(astronaut)
ax[0].set_title('Natural image')
ax[1].imshow(ihc)
ax[1].set_title('Microscopy image')
ax[2].imshow(hubble)
ax[2].set_title('Telescope image');
执行结果:
注意:当您在交互式Notebook模式下运行matplotlib时,打开的数字将保持唯一活动的数字,直到您禁用它为止,并使用图右上方的电源符号。从每个情节继续前,确保你这样做。
这些图像被称为二维或二维图像,因为它们沿着二维布局:x和y,或者用NumPy的说法,行和列或者r和c。
一些图像是3D的,因为它们具有额外的深度尺寸(z或平面)。这些包括磁共振成像(MRI)和连续切片透射电子显微镜(ssTEM),其中将样品切成薄片,如萨拉米香肠,并且每个切片分别成像。
要在matplotlib中查看这样的图像,我们必须选择一个切片,并只显示该切片。让我们尝试一下在线免费提供的MRI数据。
插曲:获取数据
我们将下载Buchel和Friston中描述的数据集,用结构方程模型和功能磁共振成像(1997)评估的皮层相互作用。首先,我们创建一个临时目录来下载数据。我们必须记得在完成分析后删除它!如果您想保留此数据集供以后使用,请更改d为您选择的更永久的目录位置。
import tempfile

# Create a temporary directory
d = tempfile.mkdtemp()
现在,让我们下载数据:
import os

# Return the tail of the path
os.path.basename('http://google.com/attention.zip')
from urllib.request import urlretrieve

# Define URL
url = 'http://www.fil.ion.ucl.ac.uk/spm/download/data/attention/attention.zip'

# Retrieve the data
fn, info = urlretrieve(url, os.path.join(d, 'attention.zip'))
并将其从
zip
文件中提取到我们的临时目录中:
import zipfile

# Extract the contents into the temporary directory we created earlier
zipfile.ZipFile(fn).extractall(path=d)
如果你看看文件的实际内容,你会发现一堆“.hdr”和“.img”文件。
# List first 10 files [f.filename for f in zipfile.ZipFile(fn).filelist[:10]]这些都是NIfTI文件格式,我们需要一个阅读器。谢天谢地,优秀的
nibabel
图书馆提供了这样的读者。请确保你无论是安装
conda install -c conda-forge nibabel
还是
pip install nibabel
,然后:
import nibabel现在,我们终于可以读取我们的图像,并使用该
.get_data()
方法获取NumPy数组来查看:
# Read the image
struct = nibabel.load(os.path.join(d, 'attention/structural/nsM00587_0002.hdr'))

# Get a plain NumPy array, without all the metadata
struct_arr = struct.get_data()
提示: 如果您想直接继续绘制MRI数据,请执行以下几行代码:
from skimage import io

struct_arr = io.imread("https://s3.amazonaws.com/assets.datacamp.com/blog_assets/attention-mri.tif")
返回到绘图
现在我们来看看该数组中的一个切片:
plt.imshow(struct_arr[75])
图:

哇!这看起来很漂亮!这是因为许多MRI中垂直轴的分辨率与水平轴不一样。我们可以通过将aspect参数传递给imshow函数来解决这个问题:
plt.imshow(struct_arr[75], aspect=0.5)

但是,为了让事情变得更简单,我们只需转置数据并仅查看水平切片,而这些切片不需要这样的摆弄。
struct_arr2 = struct_arr.T
plt.imshow(struct_arr2[34])
图:

漂亮!当然,要查看另一个切片或不同轴上的切片,我们需要再次调用imshow:
plt.imshow(struct_arr2[5])
图:

所有这些电话都相当繁琐而且很快。很长一段时间,我会使用Python以外的工具(例如ITK-SNAP)来查看3D卷。但是,事实证明,向matplotlib查看器添加3D“滚动”功能非常容易!这使我们可以在Python中探索3D数据,最大限度地减少在数据挖掘和数据分析之间切换上下文的需求。
关键是使用matplotlib 事件处理程序API,它可以让我们定义要在情节中执行的操作 - 包括更改情节的数据! - 响应特定的按键或鼠标按钮点击。
在我们的例子中,让我们将键盘上的J和K键绑定到“上一个切片”和“下一个切片”:
def previous_slice():
    pass

def next_slice():
    pass

def process_key(event):
    if event.key == 'j':
        previous_slice()
    elif event.key == 'k':
        next_slice()
够简单!当然,我们需要弄清楚如何实际执行这些操作,
并且
我们需要告诉图形,它应该使用该
process_key
功能来处理键盘按下操作!后者很简单:我们只需要使用图形画布方法
mpl_connect
:
fig, ax = plt.subplots()
ax.imshow(struct_arr[..., 43])
fig.canvas.mpl_connect('key_press_event', process_key)
你可以在mpl_connect 这里找到完整的文档,包括你可以绑定什么类型的事件(比如鼠标按钮点击)。
我花了一些时间来探索,发现它imshow返回的是一个AxesImage对象,它存在于Matplotlib Axes对象中所有绘图发生的地方,在它的.images属性中。此对象提供了一种方便的set_array方法,可以将正在显示的图像数据交换出来!所以,我们需要做的是:
- 绘制一个任意索引,并将该索引存储起来,可能作为该
Axes对象上的附加运行时属性。 - 提供改变索引的功能
next_slice和用于设置3D体积的相应切片。previous_sliceset_array - 使用图形画布
draw方法用新数据重新绘制图形。
def multi_slice_viewer(volume):
    fig, ax = plt.subplots()
    ax.volume = volume
    ax.index = volume.shape[0] // 2
    ax.imshow(volume[ax.index])
    fig.canvas.mpl_connect('key_press_event', process_key)

def process_key(event):
    fig = event.canvas.figure
    ax = fig.axes[0]
    if event.key == 'j':
        previous_slice(ax)
    elif event.key == 'k':
        next_slice(ax)
    fig.canvas.draw()

def previous_slice(ax):
    """Go to the previous slice."""
    volume = ax.volume
    ax.index = (ax.index - 1) % volume.shape[0]  # wrap around using %
    ax.images[0].set_array(volume[ax.index])

def next_slice(ax):
    """Go to the next slice."""
    volume = ax.volume
    ax.index = (ax.index + 1) % volume.shape[0]
    ax.images[0].set_array(volume[ax.index])
让我们试试吧!
multi_slice_viewer(struct_arr2)
图:

这工作!太好了!但是,如果您在家中尝试此操作,您会注意到用K滚动也会缩小绘图的水平缩放比例。咦?(只有鼠标悬停在图像上时才会发生这种情况。)
发生的事情是,向Matplotlib添加事件处理程序只是将它们堆叠在一起。在这种情况下,K是内置键盘快捷键,可将x轴更改为使用对数刻度。如果我们想单独使用K,我们必须从matplotlib默认的键映射中移除它。这些存储在plt.rcParams字典中的列表,这是matplotlib默认系统范围设置的存储库:
plt.rcParams['keymap.<command>'] = ['<key1>', '<key2>']
按下列表中的任何键(即<key1>或<key2>)将导致<command>执行。
因此,我们需要编写一个帮助函数来删除我们想要在这个字典中出现的任何地方使用的密钥。(这个函数还不存在matplotlib,但可能是一个值得欢迎的贡献!)
def remove_keymap_conflicts(new_keys_set):
    for prop in plt.rcParams:
        if prop.startswith('keymap.'):
            keys = plt.rcParams[prop]
            remove_list = set(keys) & new_keys_set
            for key in remove_list:
                keys.remove(key)
一个功能齐全的切片查看器
好的,让我们重写我们的函数来使用这个新工具:
def multi_slice_viewer(volume):
    remove_keymap_conflicts({'j', 'k'})
    fig, ax = plt.subplots()
    ax.volume = volume
    ax.index = volume.shape[0] // 2
    ax.imshow(volume[ax.index])
    fig.canvas.mpl_connect('key_press_event', process_key)

def process_key(event):
    fig = event.canvas.figure
    ax = fig.axes[0]
    if event.key == 'j':
        previous_slice(ax)
    elif event.key == 'k':
        next_slice(ax)
    fig.canvas.draw()

def previous_slice(ax):
    volume = ax.volume
    ax.index = (ax.index - 1) % volume.shape[0]  # wrap around using %
    ax.images[0].set_array(volume[ax.index])

def next_slice(ax):
    volume = ax.volume
    ax.index = (ax.index + 1) % volume.shape[0]
    ax.images[0].set_array(volume[ax.index])
现在,我们应该能够查看我们MRI体积中的所有切片,而不会受到默认键盘映射的干扰!
multi_slice_viewer(struct_arr2)关于这种方法的一个很好的功能是它可以在 任何 matplotlib后端上运行!所以,如果您在IPython终端控制台中尝试了这一点,您仍然可以获得与您在浏览器中一样的交互效果!对于嵌入matplotlib图的Qt或Tkinter应用程序也是如此。因此,这个简单的工具可以让您根据matplotlib的可视化功能构建更复杂的应用程序。
你走之前…
我们不要忘记自己清理一下,然后删除临时目录(如果你创建的话):
import shutil

# Remove the temporary directory
shutil.rmtree(d)