房价预测
摘自Python与机器需学习实践
数据样本
2104,399900
1600,329900
2400,369000
1416,232000
3000,539900
1985,299900
1534,314900
1427,198999
1380,212000
1494,242500
1940,239999
2000,347000
1890,329999
4478,699900
1268,259900
2300,449900
1320,299900
1236,199900
2609,499998
3031,599000
1767,252900
1888,255000
1604,242900
1962,259900
3890,573900
1100,249900
1458,464500
2526,469000
2200,475000
2637,299900
1839,349900
1000,169900
2040,314900
3137,579900
1811,285900
1437,249900
1239,229900
2132,345000
4215,549000
2162,287000
1664,368500
2238,329900
2567,314000
1200,299000
852,179900
1852,299900
1203,239500
代码
#导入需要用到的库
import numpy as np
import matplotlib.pyplot as plt
#定义存储输入数据(x)和目标数据(y)的数组
x, y = [], []
z = [],
#遍历数据集,变量sample对应的正是一个个样本
for sample in open("prices.txt", "r"):
#数据是使用逗号分隔的,这里使用split方法读取
_x, _y = sample.split(",")
#将字符串数据转化为浮点数
x.append(float(_x))
y.append(float(_y))
#读取完数据后,将数据转化为Numpy数组
x, y = np.array(x), np.array(y)
#标准化
x = (x - x.mean()) / x.std()
#将原始数据以散点图的形式画出
plt.figure()
plt.scatter(x, y, c="g", s=6)
plt.show()
#在(-2,4)这个区间上取100个点作为画图的基础
x0 = np.linspace(-2, 4, 100)
#利用Numpy的函数定义并返回多项式回归模型的函数
#deg参数代表着模型参数中的n,亦即模型中多项式的次数
#返回的模型能够根据输入的x(默认是x0),返回相对应的预测的y
def get_model(deg):
return lambda input_x = x0: np.polyval(np.polyfit(x, y, deg), input_x)
#根据参数n,输入的x、y返回对应的损失
def get_cost(deg, input_x, input_y):
return 0.5 * ((get_model(deg)(input_x) - input_y) ** 2).sum()
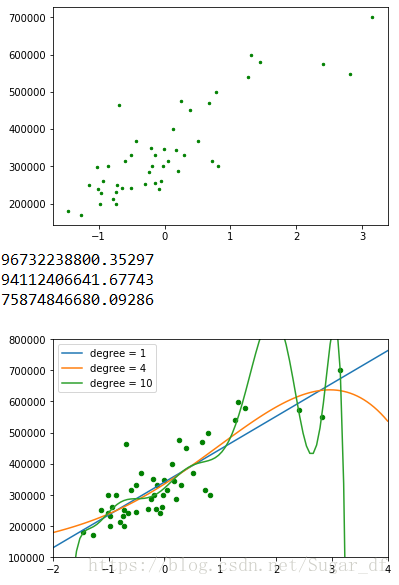
#定义测试参数集并根据它进行各种实验
test_set = (1, 4, 10)
for d in test_set:
#输出对应的损失
print(get_cost(d, x, y))
#画出对应的图像
plt.scatter(x, y, c = "g", s=20)
for d in test_set:
plt.plot(x0, get_model(d)(), label = "degree = {}".format(d))
#将横纵轴的范围限定在(-2, 4)、(10 ** 5, 8 * 10 **5)
plt.xlim(-2, 4)
plt.ylim(1e5, 8e5)
#调用legend方法使曲线对应的label正确显示
plt.legend()
plt.show()