一,介绍
密度聚类算法有多种,我们这里主要介绍一种著名的密度聚类算法:DBSCAN。
首先,我们通过下图了解几个概念:
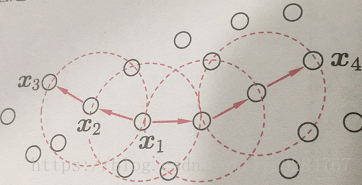
(1)邻域,与中心x距离不超过ε距离,如上图红色虚线圈
(2)核心对象,确定聚类的初始点,如上图的x1
(3)密度直达,在聚类核心对象邻域内的点,如上图x2由x1密度直达
(4)密度可达,可以通过几次密度直达后的点,如x3有x1密度可达
(5)密度相连,两个点可由一点通过密度可达方式分别到达,如x3和x4密度相连
算法流程
1,确定初始参数,邻域ε的值和核心对象密度直达最小值MinPTs的值;
2,根据初始参数,计算核心对象集合;
3,随机挑选一个核心对象作为种子,生成聚类族;
4,把包含在聚类族中的核心对象集合去除;
5,核心对象为空时,聚类结束。
二,代码实现
数据
0.697   0.46
0.774  0.376
0.634  0.264
0.608  0.318
0.556  0.215
0.403  0.237
0.481  0.149
0.437  0.211
0.666  0.091
0.243  0.267
0.245  0.057
0.343  0.099
0.639  0.161
0.657  0.198
0.36   0.37
0.593  0.042
0.719  0.103
0.359  0.188
0.339  0.241
0.282  0.257
0.748  0.232
0.714  0.346
0.483  0.312
0.478  0.437
0.525  0.369
0.751  0.489
0.532  0.472
0.473  0.376
0.725  0.445
0.446  0.459
Python代码:
import numpy as np
import math
import matplotlib.pyplot as plt

UNCLASSIFIED = False
NOISE = 0

# 读取数据
def loadDataSet(filename):
    fr = open(filename)
    numberOfLines = len(fr.readlines())
    returnMat = np.zeros((numberOfLines, 2))
    classLabelVector = ['密度','含糖率']
    fr = open(filename)
    index = 0
    for line in fr.readlines():
        line = line.strip().split('\t')
        returnMat[index, :] = line[0:2]
        index += 1
    return returnMat, classLabelVector

# 计算欧氏距离
def dist(a, b):
    return math.sqrt(np.power(a - b, 2).sum())

# 计算是否在邻域内
def eps_neighbor(a, b, eps):
    return dist(a, b) < eps

# 获取邻域内的点
def region_query(data, pointId, eps):
    nPoints = data.shape[1]
    seeds = []
    for i in range(nPoints):
        if eps_neighbor(data[:, pointId], data[:, i], eps):
            seeds.append(i)
    return seeds

# 分类结果
def expand_cluster(data, clusterResult, pointId, clusterId, eps, minPts):
    seeds = region_query(data, pointId, eps)
    if len(seeds) < minPts: # 不满足minPts条件的为噪声点
        clusterResult[pointId] = NOISE
        return False
    else:
        clusterResult[pointId] = clusterId # 划分到该簇
        for seedId in seeds:
            clusterResult[seedId] = clusterId

        while len(seeds) > 0: # 持续扩张
            currentPoint = seeds[0]
            queryResults = region_query(data, currentPoint, eps)
            if len(queryResults) >= minPts:
                for i in range(len(queryResults)):
                    resultPoint = queryResults[i]
                    if clusterResult[resultPoint] == UNCLASSIFIED:
                        seeds.append(resultPoint)
                        clusterResult[resultPoint] = clusterId
                    elif clusterResult[resultPoint] == NOISE:
                        clusterResult[resultPoint] = clusterId
            seeds = seeds[1:]
        return True

# DBSANC分类,data--数据;eps--范围;minPts--最小点
def dbscan(data, eps=0.11, minPts=5):
    clusterId = 1
    nPoints = data.shape[1]
    clusterResult = [UNCLASSIFIED] * nPoints
    for pointId in range(nPoints):
        point = data[:, pointId]
        if clusterResult[pointId] == UNCLASSIFIED:
            if expand_cluster(data, clusterResult, pointId, clusterId, eps, minPts):
                clusterId = clusterId + 1
    return clusterResult, clusterId - 1

def plotFeature(data, clusters, clusterNum):
    matClusters = np.mat(clusters).transpose()
    fig = plt.figure()
    scatterColors = ['black', 'blue', 'green', 'yellow', 'red', 'purple', 'orange', 'brown']
    ax = fig.add_subplot(111)
    for i in range(clusterNum + 1):
        colorSytle = scatterColors[i % len(scatterColors)]
        subCluster = data[:, np.nonzero(matClusters[:, 0].A == i)]
        ax.scatter(subCluster[0, :].flatten().A[0], subCluster[1, :].flatten().A[0], c=colorSytle, s=50)
    plt.show()

if __name__=="__main__":
    returnMat,classLabelVector = loadDataSet('watermelon4.0.txt')
    dataSet = np.mat(returnMat).transpose()
    clusters, clusterNum = dbscan(dataSet)
    plotFeature(dataSet, clusters, clusterNum)