运行环境:win10 64位 py 3.6 pycharm 2018.1.1
import matplotlib.pyplot as plt
import numpy as np
from sklearn import datasets,linear_model,discriminant_analysis,cross_validation

def load_data():
    diabetes = datasets.load_diabetes()
    return cross_validation.train_test_split(diabetes.data, diabetes.target, test_size=0.25, random_state=0)
def test_LinearRegression(*data):
X_train,X_test,y_train,y_test=data
regr = linear_model.LinearRegression()
regr.fit(X_train,y_train)
print('Coefficients:%s,intercept:%.2f'% (regr.coef_,regr.intercept_))
print('Residual sum of squares:%.2f'% np.mean((regr.predict(X_test)-y_test)**2))
print('Score:%.2f'% regr.score(X_test,y_test))
X_train,X_test,y_train,y_test=load_data()
test_LinearRegression(X_train,X_test,y_train,y_test
def test_Ridge(*data):
X_train,X_test,y_train,y_test=data
regr = linear_model.Ridge()
regr.fit(X_train,y_train)
print('Coefficients:%s,intercept:%.2f'% (regr.coef_,regr.intercept_))
print('Residual sum of squares:%.2f'% np.mean((regr.predict(X_test)-y_test)**2))
print('Score:%.2f'% regr.score(X_test,y_test))
X_train,X_test,y_train,y_test=load_data()
test_Ridge(X_train,X_test,y_train,y_test)
def test_Ridge_alpha(*data):
X_train,X_test,y_train,y_test=data
alphas = [0.01,0.02,0.05,0.1,0.2,0.5,1,2,5,10,20,50,100,200,500,1000]
scores = []
for i,alpha in enumerate(alphas):
regr = linear_model.Ridge(alpha=alpha)
regr.fit(X_train,y_train)
scores.append(regr.score(X_test,y_test))
fig = plt.figure()
ax=fig.add_subplot(1,1,1)
ax.plot(alphas,scores)
ax.set_xlabel(r"$\alpha$")
ax.set_ylabel(r"score")
ax.set_xscale('log')
ax.set_title("Ridge")
plt.show()
X_train,X_test,y_train,y_test=load_data()
test_Ridge_alpha(X_train,X_test,y_train,y_test)
def test_Lasso(*data):
X_train,X_test,y_train,y_test=data
regr = linear_model.Lasso()
regr.fit(X_train,y_train)
print('Coefficients:%s,intercept:%.2f'% (regr.coef_,regr.intercept_))
print('Residual sum of squares:%.2f'% np.mean((regr.predict(X_test)-y_test)**2))
print('Score:%.2f'% regr.score(X_test,y_test))
X_train,X_test,y_train,y_test=load_data()
test_Lasso(X_train,X_test,y_train,y_test)
def test_Lasso_alpha(*data):
X_train,X_test,y_train,y_test=data
alphas = [0.01,0.02,0.05,0.1,0.2,0.5,1,2,5,10,20,50,100,200,500,1000]
scores = []
for i,alpha in enumerate(alphas):
regr = linear_model.Lasso(alpha=alpha)
regr.fit(X_train,y_train)
scores.append(regr.score(X_test,y_test))
fig = plt.figure()
ax=fig.add_subplot(1,1,1)
ax.plot(alphas,scores)
ax.set_xlabel(r"$\alpha$")
ax.set_ylabel(r"score")
ax.set_xscale('log')
ax.set_title("Lasso")
plt.show()
X_train,X_test,y_train,y_test=load_data()
test_Lasso_alpha(X_train,X_test,y_train,y_test)
def test_ElasticNet(*data):
X_train,X_test,y_train,y_test=data
regr = linear_model.ElasticNet()
regr.fit(X_train,y_train)
print('Coefficients:%s,intercept:%.2f'% (regr.coef_,regr.intercept_))
print('Residual sum of squares:%.2f'% np.mean((regr.predict(X_test)-y_test)**2))
print('Score:%.2f'% regr.score(X_test,y_test))
X_train,X_test,y_train,y_test=load_data()
test_ElasticNet(X_train,X_test,y_train,y_test)
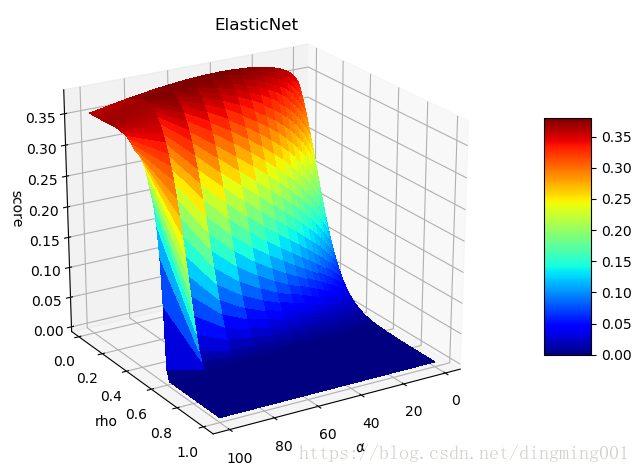
def test_ElasticNet_alpha(*data):
X_train,X_test,y_train,y_test=data
alphas = np.logspace(-2,2)
rhos = np.linspace(0.01,1)
scores = []
for alpha in alphas:
for rho in rhos:
regr = linear_model.ElasticNet(alpha=alpha,l1_ratio=rho)
regr.fit(X_train,y_train)
scores.append(regr.score(X_test,y_test))
alphas, rhos = np.meshgrid(alphas,rhos)
scores = np.array(scores).reshape(alphas.shape)
from mpl_toolkits.mplot3d import Axes3D
from matplotlib import cm
fig = plt.figure()
ax = Axes3D(fig)
surf = ax.plot_surface(alphas,rhos,scores,rstride=1,cstride=1,cmap=cm.jet,linewidth=0,antialiased=False)
fig.colorbar(surf,shrink=0.5,aspect=5)
ax.set_xlabel(r"$\alpha$")
ax.set_ylabel(r"rho")
ax.set_zlabel("score")
ax.set_title("ElasticNet")
plt.show()
X_train,X_test,y_train,y_test=load_data()
test_ElasticNet_alpha(X_train,X_test,y_train,y_test)