运行环境:win10 64位 py 3.6 pycharm 2018.1.1
import matplotlib.pyplot as plt
import numpy as np
from sklearn import datasets,linear_model,discriminant_analysis,cross_validation
def load_data():
iris = datasets.load_iris()
X_train = iris.data
y_train = iris.target
return cross_validation.train_test_split(X_train, y_train, test_size=0.25, random_state=0, stratify=y_train)
def test_LogisticRegression(*data):
    X_train, X_test ,y_train , y_test = data
    regr = linear_model.LogisticRegression()
    regr.fit(X_train, y_train)
    print("Coefficients:%s, intercept %s"%(regr.coef_,regr.intercept_))
    print("score:%.2f"% regr.score(X_test,y_test))

X_train, X_test ,y_train , y_test =  load_data()
test_LogisticRegression(X_train, X_test ,y_train , y_test)
def test_LogisticRegression_multinomial(*data):
X_train, X_test, y_train, y_test = data
regr = linear_model.LogisticRegression(multi_class="multinomial",solver='sag')
regr.fit(X_train, y_train)
print("Coefficients:%s, intercept %s" % (regr.coef_, regr.intercept_))
print("score:%.2f"% regr.score(X_test,y_test))
X_train, X_test ,y_train , y_test = load_data()
test_LogisticRegression_multinomial(X_train, X_test ,y_train , y_test)
def test_LogisticRegression_C(*data):
X_train, X_test, y_train, y_test = data
Cs = np.logspace(-2,4,100)
scores = []
for c in Cs:
regr = linear_model.LogisticRegression(C=c)
regr.fit(X_train,y_train)
scores.append(regr.score(X_test,y_test))
fig = plt.figure()
ax = fig.add_subplot(1,1,1)
ax.plot(Cs, scores)
ax.set_xlabel(r"c")
ax.set_ylabel(r"score")
ax.set_xscale("log")
ax.set_title("LogistisRegression")
plt.show()
X_train, X_test ,y_train , y_test = load_data()
test_LogisticRegression_C(X_train, X_test ,y_train , y_test)
def test_LinearDiscriminantAnalysis(*data):
X_train, X_test, y_train, y_test = data
lda = discriminant_analysis.LinearDiscriminantAnalysis()
lda.fit(X_train, y_train)
print("Coefficients:%s, intercept %s" % (lda.coef_, lda.intercept_))
print("score:%.2f" % lda.score(X_test, y_test))
X_train, X_test, y_train, y_test = load_data()
test_LinearDiscriminantAnalysis(X_train, X_test, y_train, y_test)
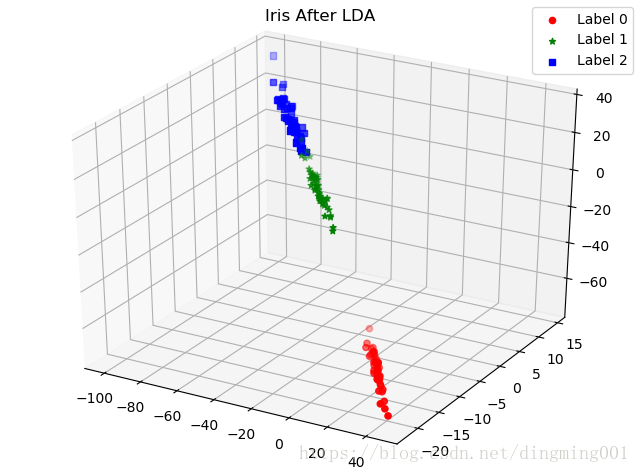
def plot_LDA(converted_X,y):
from mpl_toolkits.mplot3d import Axes3D
fig = plt.figure()
ax = Axes3D(fig)
colors = 'rgb'
markers = 'o*s'
for target,color,marker in zip([0,1,2],colors,markers):
pos=(y==target).ravel()
X=converted_X[pos,:]
ax.scatter(X[:,0],X[:,1],X[:,2],color=color,marker=marker,label="Label %d"%target)
ax.legend(loc="best")
fig.suptitle("Iris After LDA")
plt.show()
X_train, X_test, y_train, y_test = load_data()
X=np.vstack((X_train,X_test))
Y=np.vstack((y_train.reshape(y_train.size,1),y_test.reshape(y_test.size,1)))
lda = discriminant_analysis.LinearDiscriminantAnalysis()
lda.fit(X,Y)
converted_X=np.dot(X,np.transpose(lda.coef_))+lda.intercept_
plot_LDA(converted_X,Y)