运行环境:win10 64位 py 3.6 pycharm 2018.1.1
import numpy as np
from sklearn.tree import DecisionTreeRegressor
from sklearn import cross_validation
import matplotlib.pyplot as plt
def creat_data(n):
np.random.seed(0)
X = 5*np.random.rand(n, 1)
y = np.sin(X).ravel()
noise_num = (int)(n/5)
y[::5] += 3*(0.5-np.random.rand(noise_num))
return cross_validation.train_test_split(X,y,test_size=0.25,random_state=1)
#使用决策树拟合
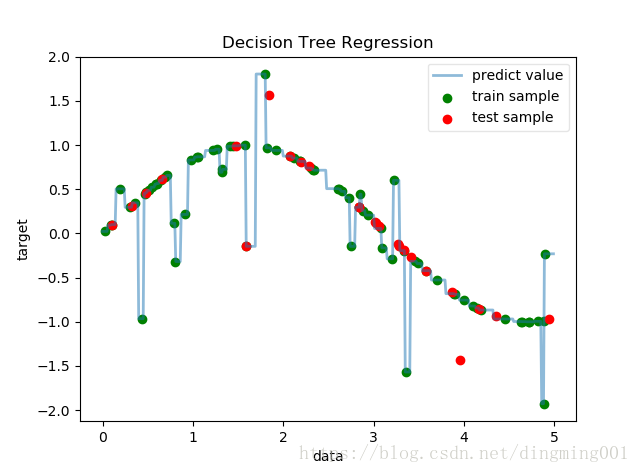
def test_DecisionTreeRegressor(*data):
X_train, X_test, y_train, y_test = data
regr = DecisionTreeRegressor()
regr.fit(X_train,y_train)
print ("Training score:%f"%(regr.score(X_train,y_train)))
print ("Test score:%f"%(regr.score(X_test,y_test)))
#绘图
fig = plt.figure()
ax = fig.add_subplot(1,1,1)
X = np.arange(0.0, 5.0, 0.01)[:, np.newaxis]
Y = regr.predict(X)
ax.scatter(X_train,y_train,label="train sample",c='g')
ax.scatter(X_test,y_test,label="test sample",c='r')
ax.plot(X,Y,label="predict value",linewidth=2,alpha=0.5)
ax.set_xlabel("data")
ax.set_ylabel("target")
ax.set_title("Decision Tree Regression")
ax.legend(framealpha=0.5)
plt.show()
X_train, X_test, y_train, y_test = creat_data(100)
print (X_train, X_test, y_train, y_test)
test_DecisionTreeRegressor(X_train, X_test, y_train, y_test)
def test_DecisionTreeRegressor_splitter(*data):
X_train, X_test, y_train, y_test = data
splitters = ['best','random']
for splitter in splitters:
regr = DecisionTreeRegressor(splitter=splitter)
regr.fit(X_train,y_train)
print("Splitter %s"%splitter)
print("Training score:%f"%(regr.score(X_train,y_train)))
print("Testing score:%f"%(regr.score(X_test,y_test)))
X_train, X_test, y_train, y_test = creat_data(100)
test_DecisionTreeRegressor_splitter(X_train, X_test, y_train, y_test)
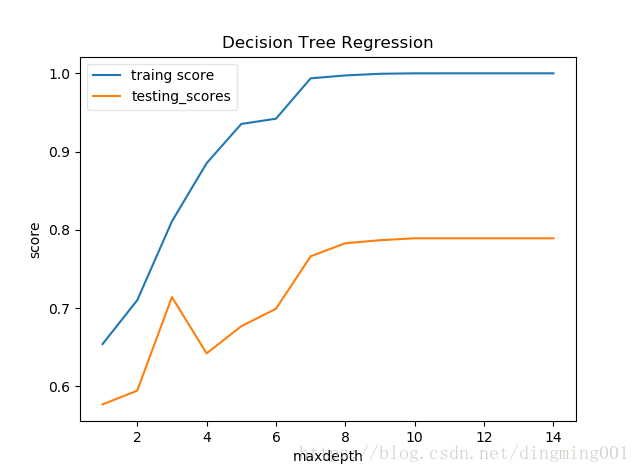
def test_DecisionTreeRegressor_depth(*data,maxdepth):
X_train, X_test, y_train, y_test = data
depths = np.arange(1,maxdepth)
training_scores = []
testing_scores = []
for depth in depths:
regr = DecisionTreeRegressor(max_depth=depth)
regr.fit(X_train,y_train)
training_scores.append(regr.score(X_train,y_train))
testing_scores.append(regr.score(X_test,y_test))
fig = plt.figure()
ax = fig.add_subplot(1,1,1)
ax.plot(depths,training_scores,label='traing score')
ax.plot(depths,testing_scores,label='testing_scores')
ax.set_xlabel("maxdepth")
ax.set_ylabel("score")
ax.set_title("Decision Tree Regression")
ax.legend(framealpha=0.5)
plt.show()
X_train, X_test, y_train, y_test = creat_data(100)
test_DecisionTreeRegressor_depth(X_train, X_test, y_train, y_test,maxdepth=15)