这篇博客主要介绍两个方面的东西,其实就是两个函数:
1. learning_curve():这个函数主要是用来判断(可视化)模型是否过拟合的,关于过拟合,就不多说了,具体可以看以前的博客:模型选择和改进
2. validation_curve():这个函数主要是用来查看在参数不同的取值下模型的性能
下面通过代码例子来看下这两个函数:
一、learning_curve()
这个函数的官方API为:官方API。部分参数含义为:
| 含义 | |
|---|---|
| estimator | 训练的模型 |
| X | 数据集样本(不包括label) |
| y | 样本label |
| train_sizes | 用于产生learning_curve的样本数量,比如[0.1,0.25,0.5,0.75,1]就是当样本是总样本数量的10%,25%,…100%时产生learning_curve,其实就是对应折线图上那几个点的横坐标(见下图),因为样本数量很多,因此都设置比例,当然你也可以直接设置样本数量,默认是np.linspace(0.1, 1.0, 5)。 |
| cv | 交叉验证的折数 |
| scoring | 模型性能的评价指标,如(‘accuracy’、‘f1’、”mean_squared_error”等) |
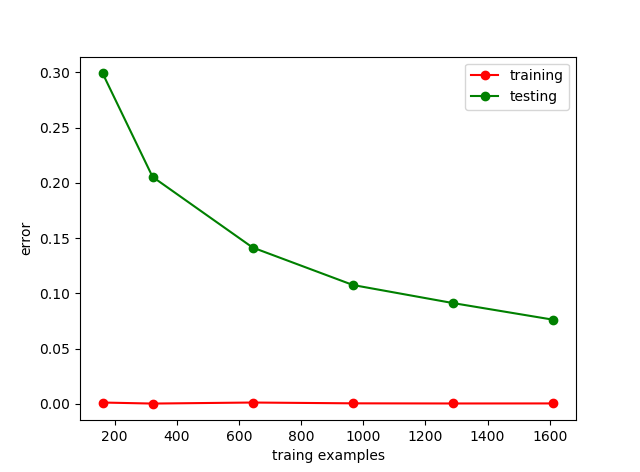
返回值:
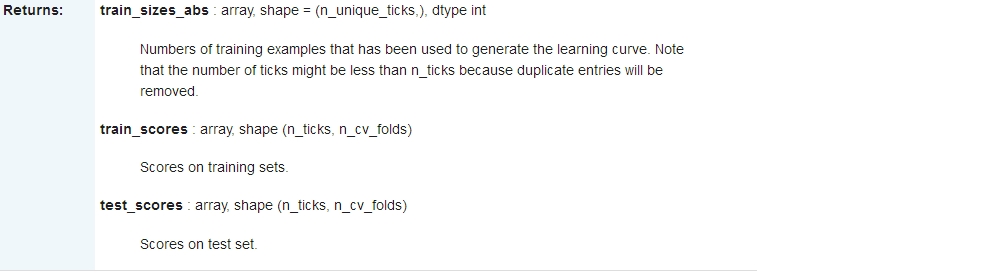
直接看个代码吧:
from sklearn import datasets
from sklearn.ensemble import RandomForestClassifier
from sklearn.model_selection import learning_curve
import numpy as np
import matplotlib.pyplot as plt

(X,y) = datasets.load_digits(return_X_y=True)
# print(X[:2,:])

train_sizes,train_score,test_score = learning_curve(RandomForestClassifier(),X,y,train_sizes=[0.1,0.2,0.4,0.6,0.8,1],cv=10,scoring='accuracy')
train_error =  1- np.mean(train_score,axis=1)
test_error = 1- np.mean(test_score,axis=1)
plt.plot(train_sizes,train_error,'o-',color = 'r',label = 'training')
plt.plot(train_sizes,test_error,'o-',color = 'g',label = 'testing')
plt.legend(loc='best')
plt.xlabel('traing examples')
plt.ylabel('error')
plt.show()
运行结果:
二、validation_curve()
官方的API为:validation_curve(),这个函数的部分重要的参数为:
| 参数 | 含义 |
|---|---|
| param_name | 要改变的参数的名字,如果当model为SVC时,改变gamma的值,求最好的那个gamma值 |
| param_range | 给定的参数范围 |
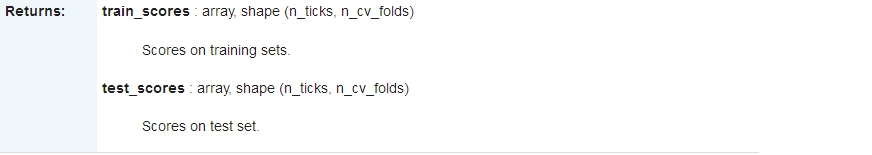
这个函数只有两个返回值:
代码示例:
from sklearn import datasets
from sklearn.ensemble import RandomForestClassifier
from sklearn.model_selection import validation_curve
import numpy as np
import matplotlib.pyplot as plt

(X,y) = datasets.load_digits(return_X_y=True)
# print(X[:2,:])
param_range = [10,20,40,80,160,250]
train_score,test_score = validation_curve(RandomForestClassifier(),X,y,param_name='n_estimators',param_range=param_range,cv=10,scoring='accuracy')
train_score =  np.mean(train_score,axis=1)
test_score = np.mean(test_score,axis=1)
plt.plot(param_range,train_score,'o-',color = 'r',label = 'training')
plt.plot(param_range,test_score,'o-',color = 'g',label = 'testing')
plt.legend(loc='best')
plt.xlabel('number of tree')
plt.ylabel('accuracy')
plt.show()
运行结果:
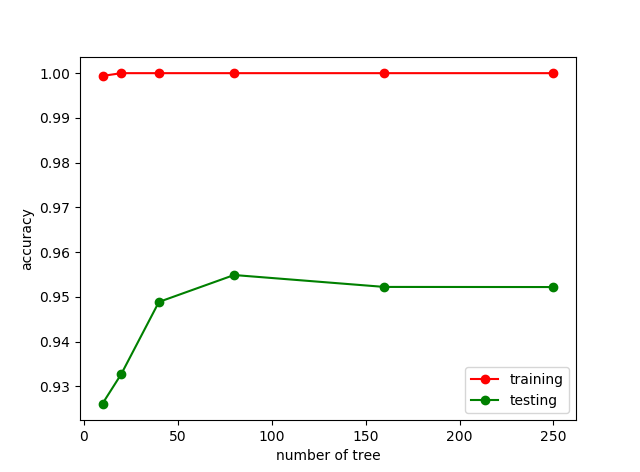
可以看到当树的数量为80-90左右的时候,model的性能最好,因此我们可以把n_estimators设置85,这样model的性能会相对好些。
以上就是learning_curve()和validation_curve()的简介。
本博文转载自https://blog.csdn.net/u012328159/article/details/79255433