机器学习理论基础
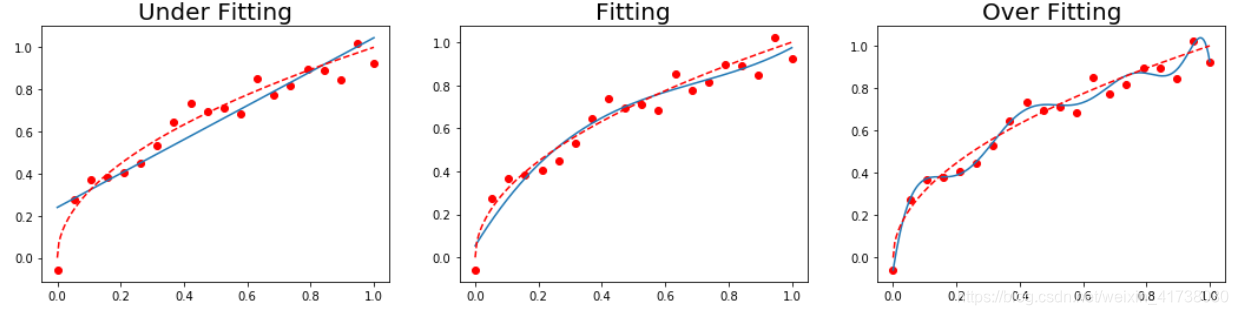
过拟合和欠拟合
过拟合是指模型能很好地拟合训练样本,但对新数据集的预测准确性很差。
欠拟合是指模型不能很好地拟合训练样本,且对新数据集的预测准确性也不好。
我们先来看个例子:
%matplotlib inline
import matplotlib.pyplot as plt
import numpy as np

n_dots = 20

x = np.linspace(0, 1, n_dots)                   # [0, 1] 之间创建 20 个点
y = np.sqrt(x) + 0.2*np.random.rand(n_dots) - 0.1

def plot_polynomial_fit(x, y, order):
    p = np.poly1d(np.polyfit(x, y, order))

    # 画出拟合出来的多项式所表达的曲线以及原始的点
    t = np.linspace(0, 1, 200)
    plt.plot(x, y, 'ro', t, p(t), '-', t, np.sqrt(t), 'r--')
    return p

plt.figure(figsize=(18, 4))
titles = ['Under Fitting', 'Fitting', 'Over Fitting']
models = [None, None, None]
for index, order in enumerate([1, 3, 10]):
    plt.subplot(1, 3, index + 1)
    models[index] = plot_polynomial_fit(x, y, order)
    plt.title(titles[index], fontsize=20)
成本函数
成本是衡量模型与训练样本符合程度的指标。
# 针对一阶多项式的模型,不同的参数拟合出来的直线和训练样本对应的位置关系
coeffs_1d = [0.2, 0.6]

plt.figure(figsize=(9, 6))
t = np.linspace(0, 1, 200)
plt.plot(x, y, 'ro', t, models[0](t), '-', t, np.poly1d(coeffs_1d)(t), 'r-')
plt.annotate(r'L1: $y = {1} + {0}x$'.format(coeffs_1d[0], coeffs_1d[1]),
             xy=(0.8, np.poly1d(coeffs_1d)(0.8)), xycoords='data',
             xytext=(-90, -50), textcoords='offset points', fontsize=16,
             arrowprops=dict(arrowstyle="->", connectionstyle="arc3,rad=.2"))
plt.annotate(r'L2: $y = {1} + {0}x$'.format(models[0].coeffs[0], models[0].coeffs[1]),
             xy=(0.3, models[0](0.3)), xycoords='data',
             xytext=(-90, -50), textcoords='offset points', fontsize=16,
             arrowprops=dict(arrowstyle="->", connectionstyle="arc3,rad=.2"))
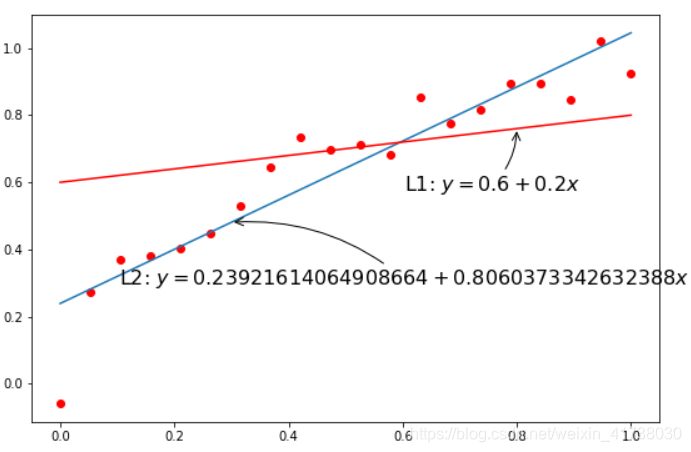
不同的模型参数
对应不同的直线,明显可以看出来 L2 比 L1 更好地你和数据集。根据成本函数的定义,我们可以容易地得到模型的成本函数公示:
模型准确度
测试数据集的成本,即 是评价模型准确性的最直观的指标, 值越小说明模型预测出来的值与实际值差异越小,对新数据的预测准确性就越好。需要特别注意,用来测试模型准确性的测试数据集,必须是模型 “没见过” 的数据。
