import sympy
from sympy.abc import x,y
y=sympy.asin(sympy.sqrt(sympy.sin(x)))
result=sympy.diff(y)
print(result)


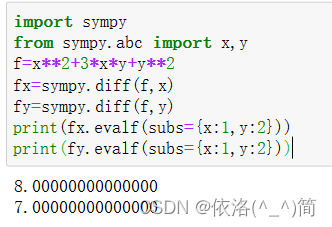
import sympy
from sympy.abc import x,y
f=x**2+3*x*y+y**2
fx=sympy.diff(f,x)
fy=sympy.diff(f,y)
print(fx.evalf(subs={

    x:1,y:2}))
print(fy.evalf(subs={

    x:1,y:2}))
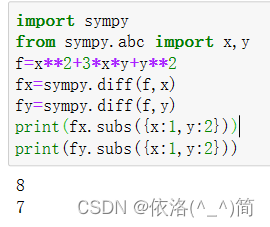
import sympy
from sympy.abc import x,y
f=x**2+3*x*y+y**2
fx=sympy.diff(f,x)
fy=sympy.diff(f,y)
print(fx.subs({

    x:1,y:2}))
print(fy.subs({

    x:1,y:2}))

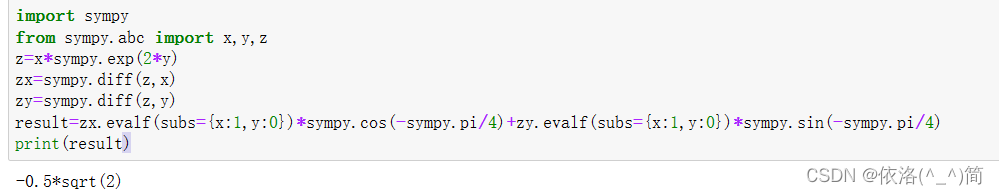
import sympy
from sympy.abc import x,y,z
z=x*sympy.exp(2*y)
zx=sympy.diff(z,x)
zy=sympy.diff(z,y)
result=zx.evalf(subs={

    x:1,y:0})*sympy.cos(-sympy.pi/4)+zy.evalf(subs={

    x:1,y:0})*sympy.sin(-sympy.pi/4)
print(result)
import sympy
from sympy.abc import x,y,z
z=x*sympy.exp(2*y)
zx=sympy.diff(z,x)
zy=sympy.diff(z,y)
result=zx.subs({

    x:1,y:0})*sympy.cos(-sympy.pi/4)+zy.subs({

    x:1,y:0})*sympy.sin(-sympy.pi/4)
print(result)

import sympy
from sympy.abc import x,y,z,u
u=x*y*z+z**2+5
ux=sympy.diff(u,x)
uy=sympy.diff(u,y)
uz=sympy.diff(u,z)
gradu = [ux.subs({

    x:0,y:1,z:-1}),uy.subs({

    x:0,y:1,z:-1}),uz.subs({

    x:0,y:1,z:-1})]
maxgradu = sympy.sqrt(gradu[0]**2+gradu[1]**2+gradu[2]**2)
print(gradu)
print(maxgradu)
import sympy
from sympy.abc import x,y,z,u
u=x*y*z+z**2+5
ux=sympy.diff(u,x)
uy=sympy.diff(u,y)
uz=sympy.diff(u,z)
gradu = [ux.evalf(subs={

    x:0,y:1,z:-1}),uy.evalf(subs={

    x:0,y:1,z:-1}),uz.evalf(subs={

    x:0,y:1,z:-1})]
maxgradu = sympy.sqrt(gradu[0]**2+gradu[1]**2+gradu[2]**2)
print(gradu)
print(maxgradu)

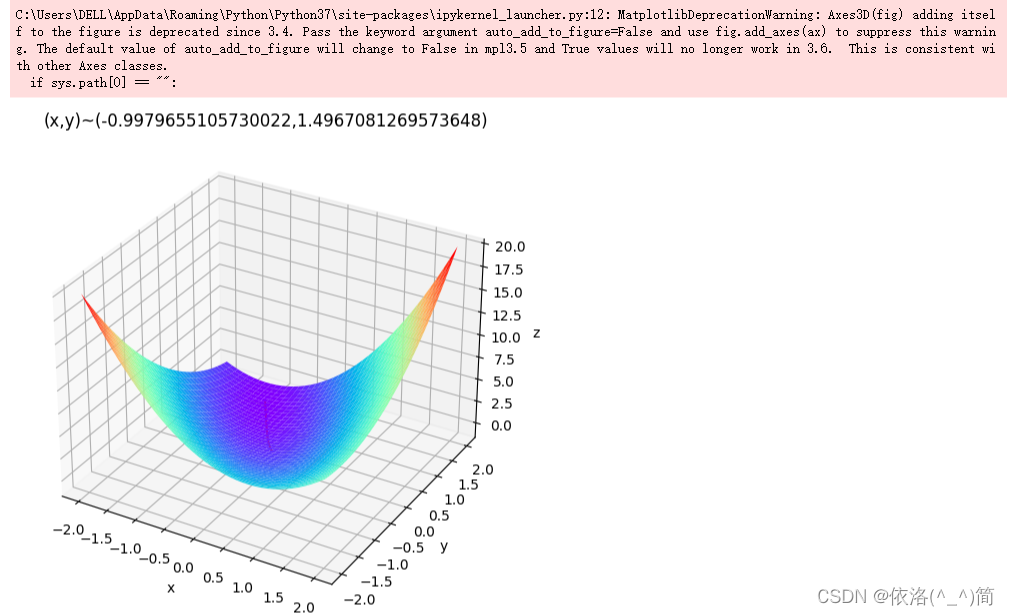
import matplotlib.pyplot as plt  #  导入matplotlib 库
from mpl_toolkits.mplot3d import Axes3D # 导入Axes3D
import numpy as np  #  导入numpy 库
def  Fun(x,y):
    return x-y+2*x*x+2*x*y+y**2      # 定义函数表达式
def  PxFun(x,y):
    return 1+4*x+2*y     # 定义沿x方向偏导数
def  PyFun(x,y):
    return -1+2*x+2*y   # 定义沿y方向偏导数

fig=plt.figure()
ax=Axes3D(fig)
X,Y=np.mgrid[-2:2:40j,-2:2:40j]
Z=Fun(X,Y)
ax.plot_surface(X,Y,Z,rstride=1,cstride=1,cmap="rainbow")
ax.set_xlabel('x')
ax.set_ylabel('y')
ax.set_zlabel('z')

step = 0.0008;
x = 0;
y = 0 ;
tag_x = [x];
tag_y = [y];
tag_z = [Fun(x,y)]
new_x = x ;
new_y = y;
Over = False
while Over == False:
    new_x -= step*PxFun(x,y);  new_y -= step*PyFun(x,y)
    if   Fun(x,y)-Fun(new_x,new_y) < 7e-9:
         Over = True
    x = new_x;    y = new_y;
    tag_x.append(x);
    tag_y.append(y);
    tag_z.append(Fun(x,y))
ax.plot(tag_x,tag_y,tag_z,'r')
plt.title('(x,y)~('+str(x)+","+str(y)+')')
plt.show()