1.mysql表的结构

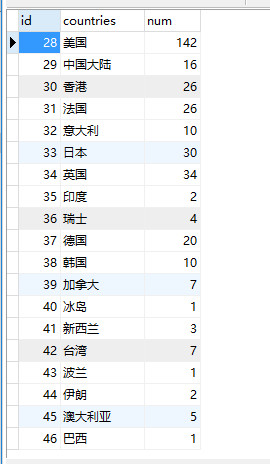
2.数据(数据是通过爬虫得来的,本篇文章不介绍怎么爬取数据,只介绍将数据库中的数据可视化):
下面就是写代码了:
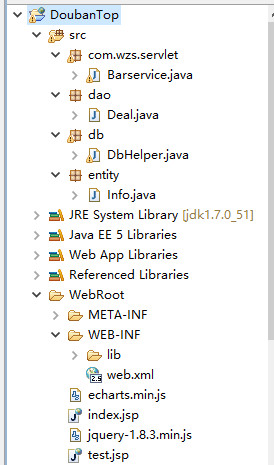
首先看一下项目目录:
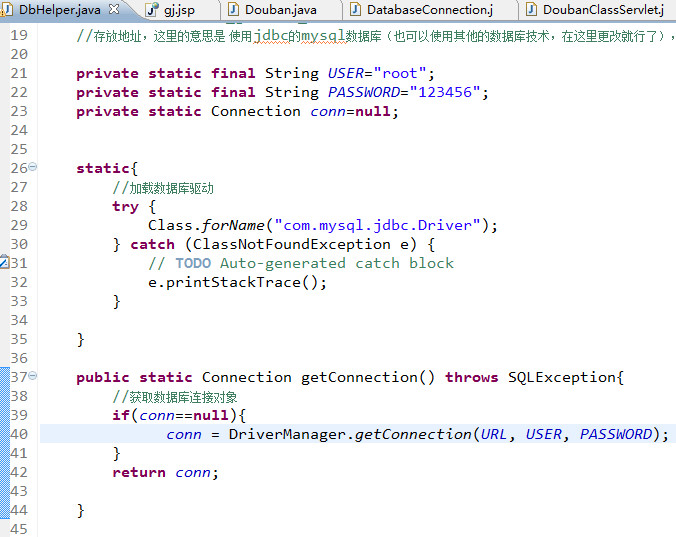
数据库层:
业务逻辑层:
package dao;
import java.sql.ResultSet;
import java.sql.SQLException;
import java.sql.Statement;
import java.util.ArrayList;
import java.sql.Connection;
import db.DbHelper;
import entity.Info;
public class Deal {
public ArrayList<Info> query(){ //这里的query()方法是将从数据库中读取到的数据存储到集合中
ResultSet rs = null;
Statement st = null;
Connection conn=null;
ArrayList<Info> barArr=new ArrayList<Info>();
try{
public ArrayList<Info> query(){ //这里的query()方法是将从数据库中读取到的数据存储到集合中
ResultSet rs = null;
Statement st = null;
Connection conn=null;
ArrayList<Info> barArr=new ArrayList<Info>();
try{
conn =DbHelper.getConnection(); //获取数据库连接对象
st = conn.createStatement();
rs = st.executeQuery("select * from doubancn");
while(rs.next()){
Info movie=new Info();
movie.setCountries(rs.getString("countries"));
movie.setNum(rs.getInt("num"));
barArr.add(movie); //使用循环将从数据库中读到的内容存储到集合对象中
}
}catch(SQLException e){
e.printStackTrace();
}
catch(Exception e){
e.printStackTrace();
}
finally{
// try{
// if(rs!=null)
// rs.close();
// }catch(Exception e){
// e.printStackTrace();
// }
// try{
// if(st!=null)
// st.close();
// }catch(Exception e){
// e.printStackTrace();
// }
// try{
// if(conn!=null)
// conn.close();
// }catch(Exception e){
// e.printStackTrace();
// }
//
}
return barArr; //返回该集合对象
}
}
实体类:
package entity;
public class Info {
private String countries;
private Integer num;
public Info(){
}
public String getCountries() {
return countries;
}
public void setCountries(String countries) {
this.countries = countries;
}
public Integer getNum() {
return num;
}
public void setNum(Integer num) {
this.num = num;
}
}
private String countries;
private Integer num;
public Info(){
}
public String getCountries() {
return countries;
}
public void setCountries(String countries) {
this.countries = countries;
}
public Integer getNum() {
return num;
}
public void setNum(Integer num) {
this.num = num;
}
}
servlet:
package com.wzs.servlet;
import java.io.IOException;
import java.io.PrintWriter;
import java.util.ArrayList;
import javax.servlet.ServletException;
import javax.servlet.http.HttpServlet;
import javax.servlet.http.HttpServletRequest;
import javax.servlet.http.HttpServletResponse;
import java.io.PrintWriter;
import java.util.ArrayList;
import javax.servlet.ServletException;
import javax.servlet.http.HttpServlet;
import javax.servlet.http.HttpServletRequest;
import javax.servlet.http.HttpServletResponse;
import dao.Deal;
import net.sf.json.JSONArray;
import entity.Info;
import entity.Info;
public class Barservice extends HttpServlet {
/**
* Constructor of the object.
*/
public Barservice() {
super();
}
* Constructor of the object.
*/
public Barservice() {
super();
}
/**
* Destruction of the servlet. <br>
*/
public void destroy() {
super.destroy(); // Just puts "destroy" string in log
// Put your code here
}
* Destruction of the servlet. <br>
*/
public void destroy() {
super.destroy(); // Just puts "destroy" string in log
// Put your code here
}
/**
* The doGet method of the servlet. <br>
*
* This method is called when a form has its tag value method equals to get.
*
* @param request the request send by the client to the server
* @param response the response send by the server to the client
* @throws ServletException if an error occurred
* @throws IOException if an error occurred
*/
public void doGet(HttpServletRequest request, HttpServletResponse response)
throws ServletException, IOException {
doPost(request, response);
}
/**
* The doPost method of the servlet. <br>
*
* This method is called when a form has its tag value method equals to post.
*
* @param request the request send by the client to the server
* @param response the response send by the server to the client
* @throws ServletException if an error occurred
* @throws IOException if an error occurred
*/
public void doPost(HttpServletRequest request, HttpServletResponse response)
throws ServletException, IOException {
Deal dl=new Deal();
ArrayList<Info> brrar=dl.query(); //调用方法,获取数据
response.setContentType("text/html;charset=utf-8");
JSONArray json=JSONArray.fromObject(brrar); //将ArrayList类型转为JSONArray类型,因为Echarts只识别JsonArray
//注意,这里需要导入许多jar包
PrintWriter writer =response.getWriter();
writer.println(json);
writer.flush();
//关闭输出流
writer.close();
}
/**
* Initialization of the servlet. <br>
*
* @throws ServletException if an error occurs
*/
public void init() throws ServletException {
// Put your code here
}
* Initialization of the servlet. <br>
*
* @throws ServletException if an error occurs
*/
public void init() throws ServletException {
// Put your code here
}
}
jsp页面代码:
<%@ page language="java" import="java.util.*" contentType="text/html; charset=utf-8"%>
<%
String path = request.getContextPath();
String basePath = request.getScheme()+"://"+request.getServerName()+":"+request.getServerPort()+path+"/";
%>
<%
String path = request.getContextPath();
String basePath = request.getScheme()+"://"+request.getServerName()+":"+request.getServerPort()+path+"/";
%>
<!DOCTYPE HTML PUBLIC "-//W3C//DTD HTML 4.01 Transitional//EN">
<html>
<head>
<base href="<%=basePath%>">
<title>My JSP 'index.jsp' starting page</title>
<meta http-equiv="pragma" content="no-cache">
<meta http-equiv="cache-control" content="no-cache">
<meta http-equiv="expires" content="0">
<meta http-equiv="keywords" content="keyword1,keyword2,keyword3">
<meta http-equiv="description" content="This is my page">
<!--
<link rel="stylesheet" type="text/css" href="styles.css">
-->
<script src="echarts.min.js"></script>
<script src="jquery-1.8.3.min.js"></script>
</head>
<body onload="loadData()"> <!-- 打开网页的时候就执行该方法加载数据 -->
<!-- 画图 -->
<h1>豆瓣TOP</h1>
<div id="content" style="margin:40px auto;">
<div id="myBarDiv" style="height:300px;width:1550px;display:inline-block"></div>
<div id="myLineDiv" style="height:300px;width:1550px;display:inline-block"></div>
<div id="myPieDiv" style="height:600px;width:1300px;display:inline-block"></div>
</div>
<script type="text/javascript">
function loadData(option){
$.ajax({
type:"post", //跳转方式
async:false, //采用同步传输
url:'servlet/Barservice', //跳转的servlet。跳转到该servlet之后执行dopost方法,获取到JSONArray类型的数据,可以被Echarts识别。
data:{},
dataType:'json',
success:function(result){
if(result){
option.xAxis[0].data=[];
for(var i=0;i<result.length;i++){
option.xAxis[0].data.push(result[i].countries); //设置横坐标的数据
}
//初始化series[0]的data
option.series[0].data=[];
for(var i=0;i<result.length;i++){
option.series[0].data.push(result[i].num); //设置纵坐标的数据
}
}
},
error:function(errorMsg){
alert("数据加载失败");
}
});
}
//初始化Echarts
var myChart=echarts.init(document.getElementById('myBarDiv'));
var option={
title:{
text:'柱状图'
},
tooltip:{
show:true
},
legend:{
data:['数量']
},
xAxis:[{
type:'category',
axisTick:{
alignWithLabel: true,//竖线对准文字
interval:0, //横坐标的竖线的间隔
},
axisLabel:{
interval:0
} //横坐标显示全部信息
}],
yAxis:[{
type:'value'
}],
series:[{
name:'数量',
type:'bar',
}]
};
loadData(option); //加载数据到option
myChart.setOption(option); //设置option(画图)
</script>
<script type="text/javascript">
function loadData(option){
$.ajax({
type:"post", //跳转方式
async:false, //采用同步传输
url:'servlet/Barservice', //跳转的servlet。跳转到该servlet之后执行dopost方法,获取到JSONArray类型的数据,可以被Echarts识别。
data:{},
dataType:'json',
success:function(result){
if(result){
option.xAxis[0].data=[];
for(var i=0;i<result.length;i++){
option.xAxis[0].data.push(result[i].countries); //设置横坐标的数据
}
//初始化series[0]的data
option.series[0].data=[];
for(var i=0;i<result.length;i++){
option.series[0].data.push(result[i].num); //设置纵坐标的数据
}
}
},
error:function(errorMsg){
alert("数据加载失败");
}
});
}
var myChart=echarts.init(document.getElementById('myLineDiv'));
var option={
title:{
text:'折线图'
},
tooltip:{
show:true,
trigger:'item'
},
legend:{
data:['数量']
},
toolbox:{ //工具栏组件
show:true,
feature:{ //需要的功能
saveAsImage:{
show:true
}, //保存为图片
dataView:{
show:true //数据视图
},
dataZoom:{
show:true //区域缩放与区域缩放还原
},
magicType:{
type:['line','bar'] //动态类型转换
}
show:true //区域缩放与区域缩放还原
},
magicType:{
type:['line','bar'] //动态类型转换
}
}
},
xAxis:[{
type:'category',
axisTick:{
alignWithLabel: true,//竖线对准文字
interval:0, //坐标轴刻度标签的显示间隔(在类目轴中有效哦),默认会采用标签不重叠的方式显示标签(也就是默认会将部分文字显示不全)
//可以设置为0强制显示所有标签,如果设置为1,表示隔一个标签显示一个标签,如果为3,表示隔3个标签显示一个标签,以此类推
},
axisLabel:{
interval:0
} //显示全部信息
}],
yAxis:[{
type:'value'
}],
series:[{
name:'数量',
type:'line'
}]
},
xAxis:[{
type:'category',
axisTick:{
alignWithLabel: true,//竖线对准文字
interval:0, //坐标轴刻度标签的显示间隔(在类目轴中有效哦),默认会采用标签不重叠的方式显示标签(也就是默认会将部分文字显示不全)
//可以设置为0强制显示所有标签,如果设置为1,表示隔一个标签显示一个标签,如果为3,表示隔3个标签显示一个标签,以此类推
},
axisLabel:{
interval:0
} //显示全部信息
}],
yAxis:[{
type:'value'
}],
series:[{
name:'数量',
type:'line'
}]
};
loadData(option); //加载数据到option
myChart.setOption(option); //设置option
</script>
loadData(option); //加载数据到option
myChart.setOption(option); //设置option
</script>
<script type="text/javascript">
var myChart=echarts.init(document.getElementById('myPieDiv'));
function loadData(option){
$.ajax({
type:"post", //跳转方式
async:false, //采用同步传输
url:'servlet/Barservice', //跳转的servlet。跳转到该servlet之后执行dopost方法,获取到JSONArray类型的数据,可以被Echarts识别。
data:{},
dataType:'json',
success:function(result){
if(result){
var country=[];
var number=[]; //定义两个数组,用来存放饼状图的legend和data.
for(var i=0;i<result.length;i++){
country[i]=result[i].countries;
var obj =new Object();
obj.name=result[i].countries;
obj.value=result[i].num;
number[i]=obj;
}
var option={
title:{
text:'饼状图',
x:'center'
},
tooltip:{
show:true, //注意:饼状图的数据的动态获取需要将option放在result里面。这与柱状图和折线图不同
trigger:'item'
},
legend:{
data:country, //这里的legend使用的是数组,在上面动态获取的
left:'left',
orient:'vertical'
},
series:[{
name:'数量',
type:'pie',
radius:'60%',
data:number //这里的number也是数组,他里面存的是对象,拥有name和value两个属性,也是在上面动态获取到的数据
}]
};
myChart.setOption(option);
}
},
error:function(errorMsg){
alert("数据加载失败");
}
});
}
myChart.setOption(option);
}
},
error:function(errorMsg){
alert("数据加载失败");
}
});
}
</script>
</body>
</html>
</html>
运行结果:


至此,整个项目就完成了,通过Ajax和java的相关知识再使用Echarts工具实现 从数据库中读取数据并将数据可视化。我们还可以做数据的增删改查,只需要在业务逻辑层加上新的方法。通过另外一个servlet调用,并在jsp页面通过Ajax将需要修改的字段传过去即可。具体的方法就不再演示了。至此,豆瓣电影TOP250的按国家分类的可视化就完成了。我们还可以按剧情分类 并可视化出来 方法一样的,只是利用的数据表不同。