第一篇文章里已经通过写python爬虫程序获取到了豆瓣电影Top250有关的数据,这里对保存在Excel里的电影信息进行数据分析和可视化。
技术要点
- pandas读取Excel中指定列的数据
- collections.Counter用来统计相关元素出现的次数
- matplotlib绘制条形图、散点图
- wordcloud绘制词云
1. 上映高分电影数量最多的年份Top10
import collections
import pandas as pd
from matplotlib import pyplot as plt


# 读取数据
df = pd.read_excel("movie.xlsx")
# print(type(df))    # <class 'pandas.core.frame.DataFrame'>

show_time = list(df["上映时间"])
# 有上映时间数据是1961(中国大陆)这样的  处理一下  字符串切片
show_time = [s[:4] for s in show_time]

show_time_count = collections.Counter(show_time)

# 取数量最多的前10  得到一个列表  里面每个元素是元组
# (年份, 数量)
show_time_count = show_time_count.most_common(10)
# 字典推导式
show_time_dic = {k: v for k, v in show_time_count}

# 按年份排序
show_time = sorted(show_time_dic)
# 年份对应高分电影数量
counts = [show_time_dic[k] for k in show_time]

plt.figure(figsize=(9, 6), dpi=100)
# 设置字体
plt.rcParams['font.sans-serif'] = ['Microsoft YaHei']

# 绘制条形图
plt.bar(show_time, counts, width=0.5, color="cyan")

# y轴刻度重新设置一下
plt.yticks(range(0, 16, 2))

# 添加描述信息
plt.xlabel("年份")
plt.ylabel("高分电影数量")
plt.title("上映高分电影数量最多的年份Top10", fontsize=15)

# 添加网格  网格的透明度  线条样式
plt.grid(alpha=0.2, linestyle=":")

plt.show()

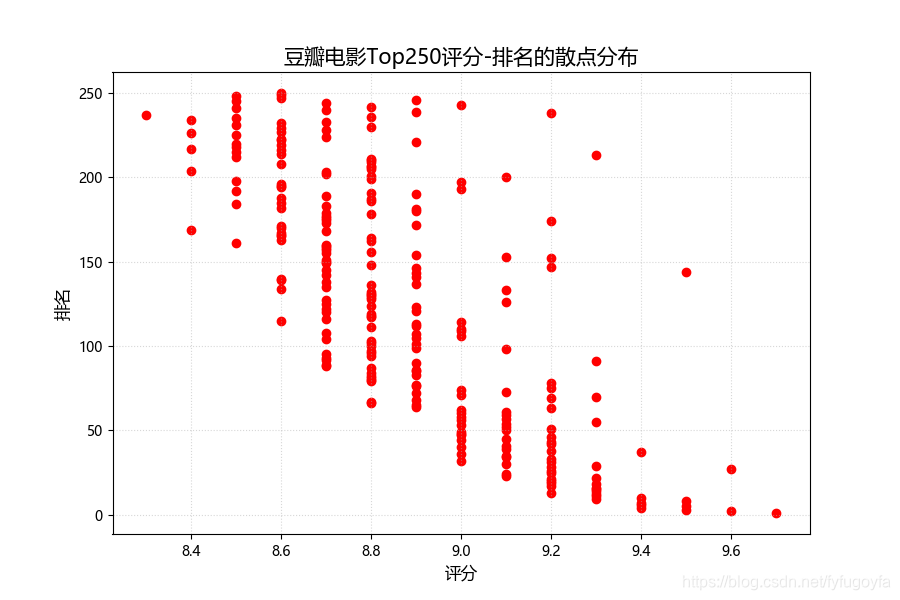
2. 豆瓣电影Top250评分-排名的散点分布
import pandas as pd
from matplotlib import pyplot as plt

# 读取数据
df = pd.read_excel("movie.xlsx")

# 豆瓣电影Top250  排名  评分  散点图   描述关系
rating = list(df["排名"])
rating_score = list(df["评分"])


plt.figure(figsize=(9, 6), dpi=100)
# 设置字体
plt.rcParams['font.sans-serif'] = ['Microsoft YaHei']

# 绘制散点图  设置点的颜色
plt.scatter(rating_score, rating, c='r')

# 添加描述信息  设置字体大小
plt.xlabel("评分", fontsize=12)
plt.ylabel("排名", fontsize=12)
plt.title("豆瓣电影Top250评分-排名的散点分布", fontsize=15)

# 添加网格  网格的透明度  线条样式
plt.grid(alpha=0.5, linestyle=":")

plt.savefig('test2.PNG')
plt.show()
3. 电影类型分析
import collections
import xlrd
import matplotlib.pyplot as plt
from wordcloud import WordCloud

# 读取数据
data = xlrd.open_workbook('movie.xlsx')
table = data.sheets()[0]
type_list = []
for i in range(1, table.nrows):
    x = table.row_values(i)
    genres = x[5].split(" ")
    for j in genres:
        type_list.append(j)

type_count = collections.Counter(type_list)

# 绘制词云
my_wordcloud = WordCloud(
    max_words=100,           # 设置最大显示的词数
    font_path='simhei.ttf',  # 设置字体格式
    max_font_size=66,        # 设置字体最大值
    random_state=30,         # 设置随机生成状态,即多少种配色方案
    min_font_size=12,        # 设置字体最小值
).generate_from_frequencies(type_count)

# 显示生成的词云图片
plt.imshow(my_wordcloud, interpolation='bilinear')
plt.axis('off')
plt.savefig('test3.PNG')
plt.show()

4. 国家或地区上榜电影数量最多的Top10
import pandas as pd
import collections
from matplotlib import pyplot as plt

df = pd.read_excel('movie.xlsx')
area = list(df['上映地区'])
sum_area = []
for x in area:
    x = x.split(" ")
    for i in x:
        sum_area.append(i)

area_count = collections.Counter(sum_area)
area_dic = dict(area_count)
area_count = [(k, v) for k, v in list(area_dic.items())]
# 按国家或地区上榜电影数量排序
area_count.sort(key=lambda k: k[1])
# 取国家或地区上榜电影数量最多的前十
area = [m[0] for m in area_count[-10:]]
nums = [m[1] for m in area_count[-10:]]


plt.figure(figsize=(9, 6), dpi=100)
# 设置字体
plt.rcParams['font.sans-serif'] = ['Microsoft YaHei']
# 绘制横着的条形图
plt.barh(area, nums, color='red')

# 添加描述信息
plt.xlabel('电影数量')
plt.title('国家或地区上榜电影数量最多的Top10')

plt.savefig('test4.PNG')
plt.show()

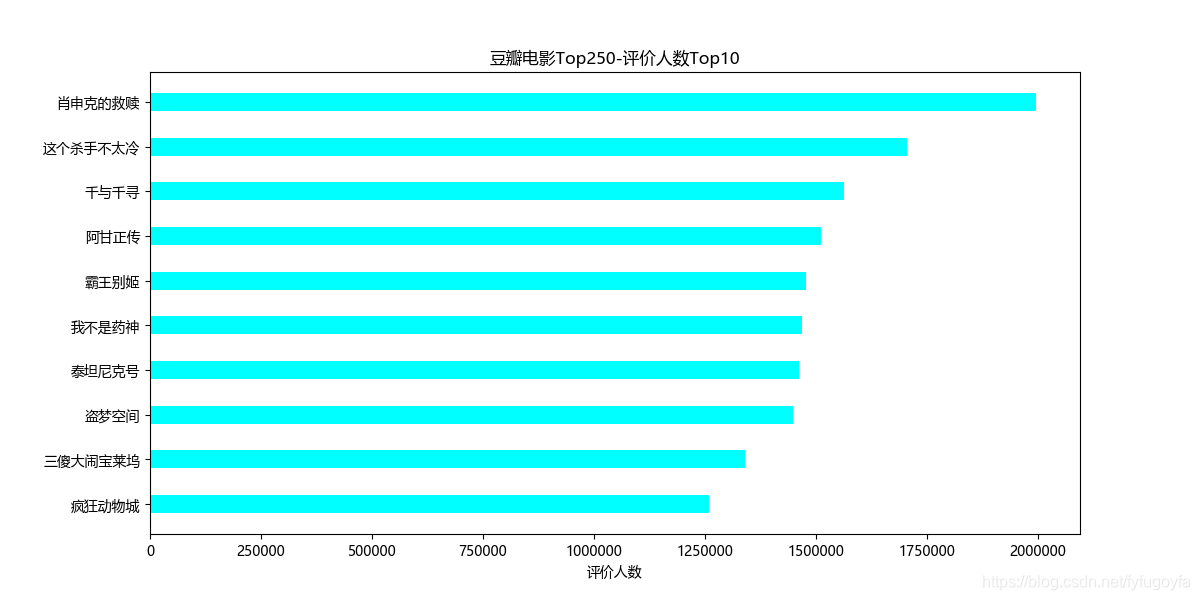
5. 豆瓣电影Top250-评价人数Top10
import pandas as pd
from matplotlib import pyplot as plt

df = pd.read_excel('movie.xlsx')
name = list(df['电影名'])
ranting_num = list(df['评价人数'])
# (电影名, 评价人数)
info = [(m, int(n.split('人')[0])) for m, n in list(zip(name, ranting_num))]
# 按评价人数排序
info.sort(key=lambda x: x[1])
# print(info)

name = [x[0] for x in info[-10:]]
ranting_num = [x[1] for x in info[-10:]]

plt.figure(figsize=(12, 6), dpi=100)
# 设置字体
plt.rcParams['font.sans-serif'] = ['Microsoft YaHei']

# 绘制横着的条形图
plt.barh(name, ranting_num, color='cyan', height=0.4)

# 添加描述信息
plt.xlabel('评价人数')
plt.title('豆瓣电影Top250-评价人数Top10')

plt.savefig('test5.PNG')
plt.show()
6. 对肖申克的救赎的部分评论进行文本分词并绘制词云

7. 补充说明
- 本项目仅用于技术交流和学习
- 欢迎提出改进意见,以期共同进步。