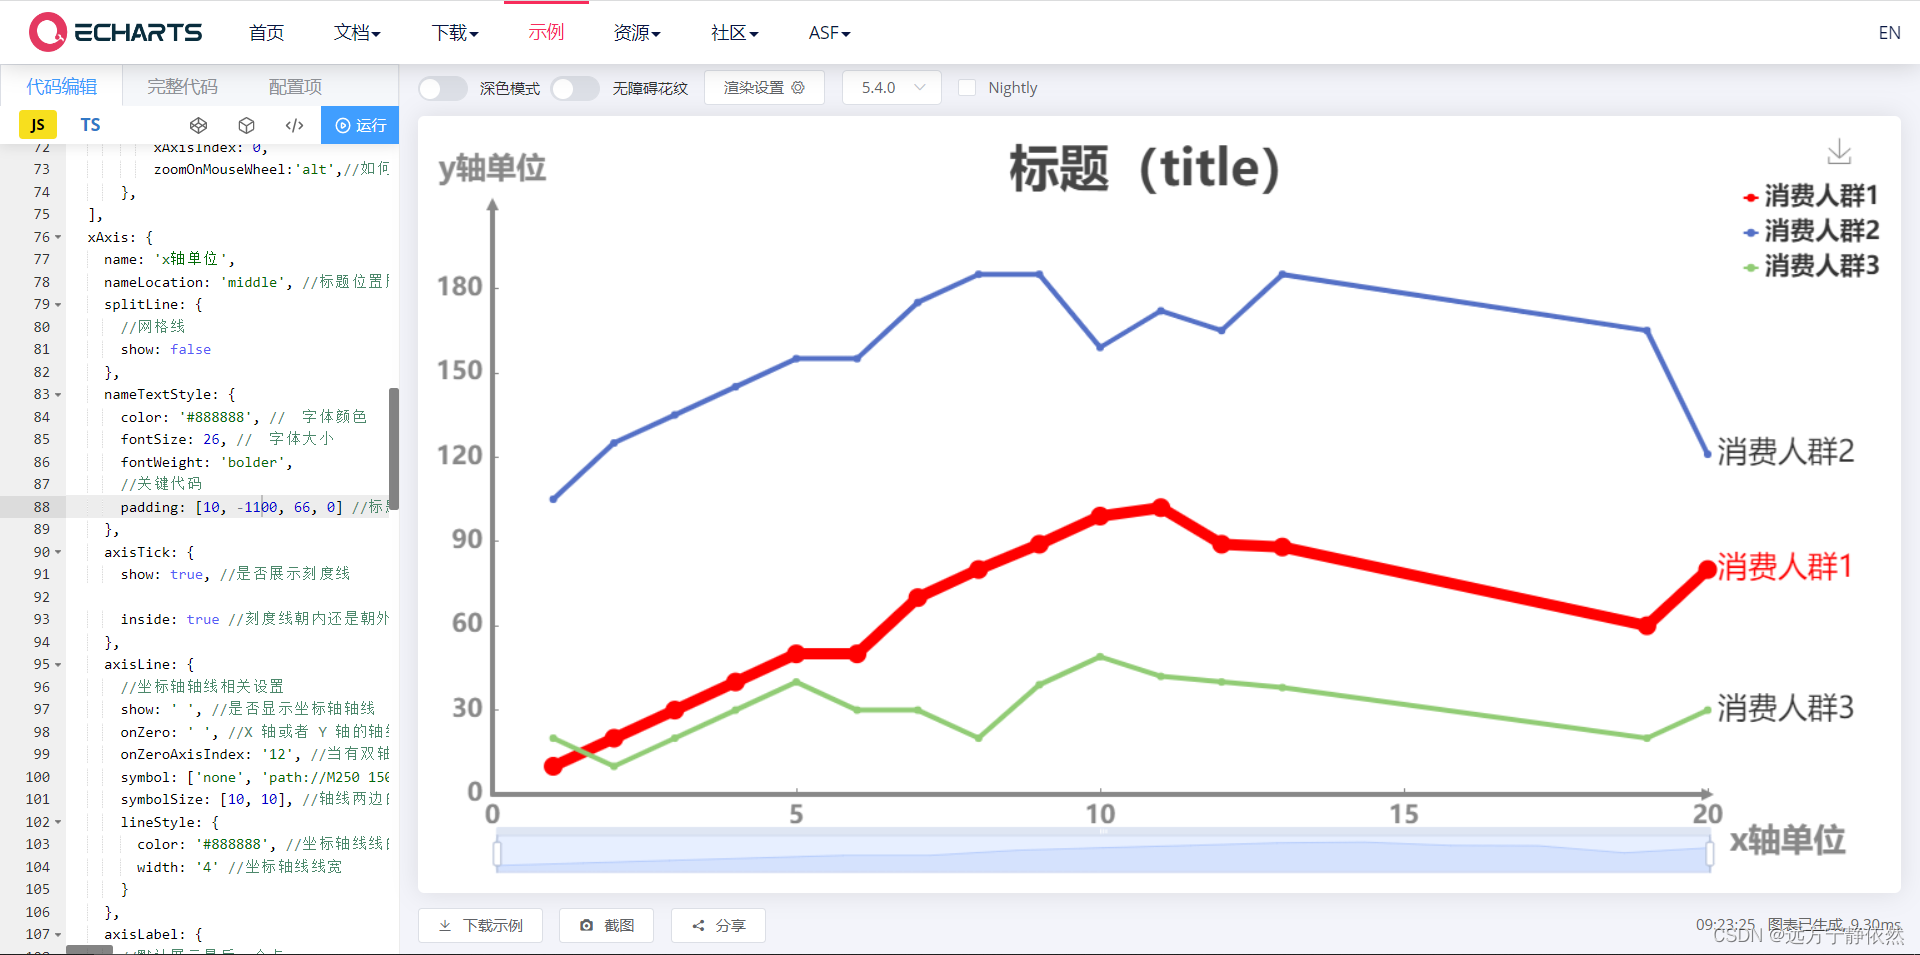
超全的echarts折线图样式整理
本次记录了echarts的折线颜色修改、自定义展示折线最后一个数值内容、自定义折线内容颜色、自定义折线图缩放展示、x轴线条粗细调整、x轴箭头单箭头调整、y轴线条粗细调整、自定义图例位置、自定义下载按钮颜色和大小设置等功能。
功能如下图:
详细代码如下:
option = {


  title: {


    top: 10,
    text: '标题(title)',
    left: 'center',
    textStyle: {


      //字体风格,'normal','italic','oblique'
      fontStyle: 'normal',
      //字体粗细 'normal','bold','bolder','lighter',100 | 200 | 300 | 400...
      fontWeight: 'bolder',
      //字体系列
      fontFamily: 'san-serif',
      //字体大小
      fontSize: 40
    }
  },
  legend: {


    show: true, //是否显示图例
    itemGap: 8, //图例间距
    right: 2,
    top: 40,
    bottom: 40,
    orient: 'vertical',
    //图例大小
    itemHeight: 8,
    itemWidth: 12,
    textStyle: {


      //图例字体大小
      fontSize: 20,
      fontWeight: 'bolder'
    }
  },
   toolbox: {


    top: "top",//设置展示位置
    right: "2%",//设置与右侧的边距
    iconStyle: {


      borderColor: "#888888",  // 图标默认颜色
    },
    emphasis: {


      iconStyle: {


        borderColor: "#54C3F1",  // 图标hover颜色
      },
    },
    itemSize: 20, // 设置图标大小
    feature: {


      saveAsImage: {

    }//展示下载按钮
    }
  },
  grid: {


    //图表与边框的距离
    top: 60,
    right: 145,
    left: 50,
    bottom: 70
  },
  tooltip: {


    trigger: 'axis',
    align: 'left',
    extraCssText: '100px;',
    appendToBody: true
  },
   dataZoom: [
     //加上dataZoom可实现缩放
      {


          type: 'inside',//x轴
          xAxisIndex: 0,

      },
      {


        show:true,
          type: 'slider',//x轴
          xAxisIndex: 0,
          zoomOnMouseWheel:'alt',//如何触发缩放。可选值为:true:表示不按任何功能键,鼠标滚轮能触发缩放。false:表示鼠标滚轮不能触发缩放。'shift':表示按住 shift 和鼠标滚轮能触发缩放。'ctrl':表示按住 ctrl 和鼠标滚轮能触发缩放。'alt':表示按住 alt 和鼠标滚轮能触发缩放。
      },
  ],
  xAxis: {


    name: 'x轴单位',
    nameLocation: 'middle', //标题位置居中
    splitLine: {


      //网格线
      show: false
    },
    nameTextStyle: {


      color: '#888888', //  字体颜色
      fontSize: 26, //  字体大小
      fontWeight: 'bolder',
      //关键代码
      padding: [10, -800, 66, 0] //标题位置调整 上 右 下 左
    },
    axisTick: {


      show: true, //是否展示刻度线

      inside: true //刻度线朝内还是朝外
    },
    axisLine: {


      //坐标轴轴线相关设置
      show: ' ', //是否显示坐标轴轴线
      onZero: ' ', //X 轴或者 Y 轴的轴线是否在另一个轴的 0 刻度
      onZeroAxisIndex: '12', //当有双轴时,可以用这个属性手动指定,在哪个轴的 0 刻度上
      symbol: ['none', 'path://M250 150 L150 350 L350 350 Z'], //轴线两边的箭头
      symbolSize: [10, 10], //轴线两边的箭头的大小,第一个数字表示宽度(垂直坐标轴方向),第二个数字表示高度(平行坐标轴方向)
      lineStyle: {


        color: '#888888', //坐标轴线线的颜色
        width: '4' //坐标轴线线宽
      }
    },
    axisLabel: {


      //默认展示最后一个点
      fontSize: '20', //文字的字体大小
      fontWeight: 'bold',
      showMaxLabel: true
    },
    type: 'value' //类型
  },
  yAxis: {


    name: 'y轴单位',
    nameTextStyle: {


      //  单位样式
      color: '#888888', //  字体颜色
      fontWeight: 'bold',
      fontSize: 24 //  字体大小
    },
    axisLine: {


      show: true, //是否显示y轴
      symbol: ['none', 'path://M250 150 L150 350 L350 350 Z'], //轴线两边的箭头
      lineStyle: {


        color: '#888888', //坐标轴线线的颜色
        width: '4' //坐标轴线线宽
      }
    },
    axisTick: {


      //是否展示刻度线
      show: true,
      inside: true //刻度线朝内还是朝外
    },
    axisLabel: {


      //默认展示最后一个点
      fontSize: '20', //文字的字体大小
      fontWeight: 'bold',//加粗
      showMaxLabel: false
    },
    splitLine: {


      //网格线
      show: false
    },
    type: 'value',
    show: true
  },
  series: [
    {


      name: '消费人群1',
      data: [
        [1, 10], [2, 20], [3, 30], [4, 40], [5, 50], [6, 50], [7, 70],
        [8, 80], [9, 89], [10, 99], [11, 102], [12, 89], [13, 88], [19, 60], [20, 80]
      ],
      symbol: 'circle', //将小圆点改成实心 不写symbol默认空心
      symbolSize: 15, //小圆点的大小
      type: 'line', //折线类型
      itemStyle: {


        normal: {


          color: 'red',//折线图与小圆点颜色
          lineStyle: {


            width: 9 //线条宽度
          }
        }
      },
      endLabel: {


        show: true,
        fontSize: 24,
        color: 'red',
        formatter: function (value) {


          return value.seriesName;
        }
      },
      labelLine: {


        showAbove: true
      }
    },
    {


      name: '消费人群2',
      data: [
        [1, 105],[2, 125],[3, 135],[4, 145],[5, 155],[6, 155],[7, 175],
        [8, 185],[9, 185],[10, 159],[11, 172],[12, 165],[13, 185], [19, 165],[20, 121]
      ],
      symbol: 'circle', //将小圆点改成实心 不写symbol默认空心
      symbolSize: 6, //小圆点的大小
      itemStyle: {


        normal: {


            lineStyle: {


              width:4//线条宽度
            }
        }
      },
      type: 'line', //折线类型
      endLabel: {


        show: true,
        fontSize: 24,
        formatter: function (value) {


          return value.seriesName;
        }
      },
      labelLine: {


        showAbove: true
      }
    },
    {


      name: '消费人群3',
      data: [
        [1, 20],[2, 10],[3, 20],[4, 30],[5, 40],[6, 30],[7, 30],
        [8, 20],[9, 39], [10, 49],[11, 42],[12, 40],[13, 38],[19, 20],[20, 30]
      ],
      symbol: 'circle', //将小圆点改成实心 不写symbol默认空心
      symbolSize: 6, //小圆点的大小
      itemStyle: {


        normal: {


            lineStyle: {


              width:4//线条宽度
            }
        }
      },
      type: 'line', //折线类型
      endLabel: {


        show: true,
        fontSize: 24,
        formatter: function (value) {


          return value.seriesName;
        }
      },
      labelLine: {


        showAbove: true
      }
    }
  ]
};