# 画子图

# 导入库
import pandas as pd
import numpy as np
from pandas import Series, DataFrame
import matplotlib.pyplot as plt
# 等差数列50个值
x = np.linspace(0.0, 5.0)
# 生成两个y轴坐标
y1 = np.sin(np.pi*x)
y2 = np.sin(np.pi*x*2)
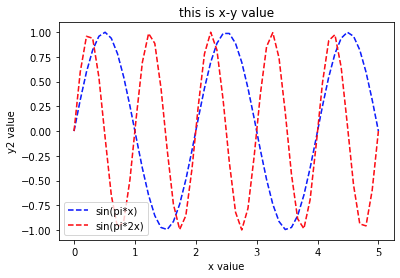
# 画线
plt.plot(x, y1, 'b--', label='sin(pi*x)')
plt.ylabel('y1 value')
plt.plot(x, y2, 'r--', label='sin(pi*2x)')
plt.ylabel('y2 value')
plt.xlabel('x value')
plt.title('this is x-y value')
# 显示线的label
plt.legend()
<matplotlib.legend.Legend at 0x116526d90>
# 法1:子图
# 两行两列-切分
plt.subplot(2,2,1)#也可以直接plt.subplot(221)
plt.plot(x, y1, 'b--')
plt.ylabel('y1')
plt.subplot(2,2,2)
plt.plot(x,y2,'r--')
plt.ylabel('y2')
plt.xlabel('x')
plt.subplot(2,2,3)
plt.plot(x, y1, 'b*')
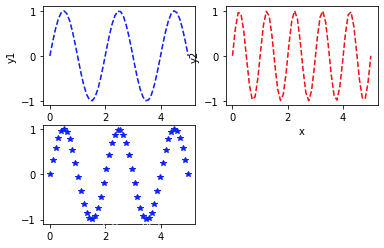
[<matplotlib.lines.Line2D at 0x116769150>]
# 法2:子图
# a[0]画布
a = plt.subplots()

type(a)
tuple
figure, ax = plt.subplots()

ax.plot([1,2,3,4])
[<matplotlib.lines.Line2D at 0x118595a10>]
plt.show()
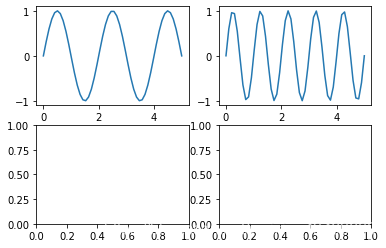
# 建议放在一起执行,容易重复切割
f,a = plt.subplots(2,2)
a[0][0].plot(x,y1)
a[0][1].plot(x,y2)
plt.show()