import numpy as np
import pandas as pd
import matplotlib.pyplot as plt
from pandas import Series,DataFrame
df = DataFrame(
    # 范围1~10取40个
    np.random.randint(1,10,40).reshape(10,4),
    columns=['A','B','C','D']
)
df
| A | B | C | D | |
|---|---|---|---|---|
| 0 | 4 | 6 | 4 | 2 |
| 1 | 8 | 6 | 5 | 3 |
| 2 | 5 | 4 | 6 | 3 |
| 3 | 9 | 5 | 9 | 4 |
| 4 | 6 | 8 | 5 | 2 |
| 5 | 5 | 9 | 2 | 6 |
| 6 | 9 | 4 | 9 | 4 |
| 7 | 9 | 3 | 2 | 1 |
| 8 | 1 | 3 | 4 | 7 |
| 9 | 6 | 3 | 4 | 9 |
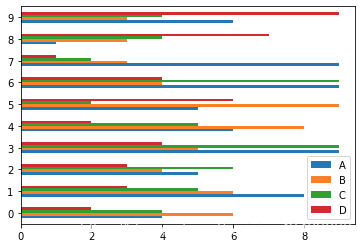
# 按列名画图
# 默认按DataFrame每列画一条曲线
# 参数和Series一样可以设置
df.plot(kind='barh')
<matplotlib.axes._subplots.AxesSubplot at 0x119f0a850>
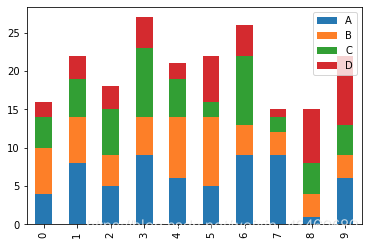
# 图像堆叠
df.plot(kind='bar', stacked=True)
<matplotlib.axes._subplots.AxesSubplot at 0x119585cd0>
# 填充方式
df.plot(kind='area')
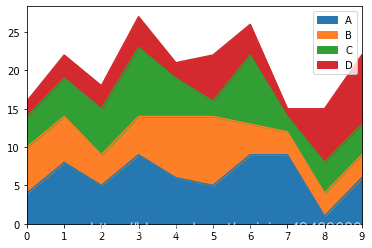 <matplotlib.axes._subplots.AxesSubplot at 0x119922c90>
# 除了上述对列取值,对行取值
a = df.iloc[5]
a
A    5
B    9
C    2
D    6
Name: 5, dtype: int64
type(a)
pandas.core.series.Series
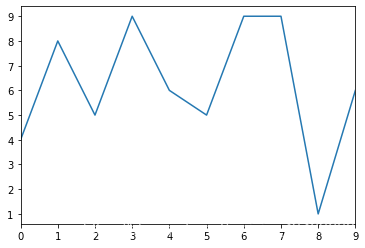
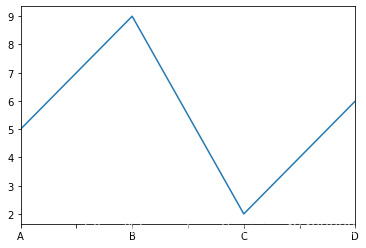
# 某一行取值
df.iloc[5].plot()
<matplotlib.axes._subplots.AxesSubplot at 0x11b5daa90>
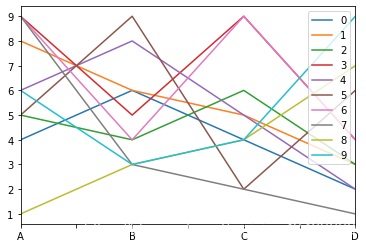
# 取所有的行
for i in df.index:
    df.iloc[i].plot(label = str(i))
plt.legend()
<matplotlib.legend.Legend at 0x11b4ed790>

# 更简单的取所有行操作 转置
df.T.plot()
<matplotlib.axes._subplots.AxesSubplot at 0x11f1733d0>
# 取一列
df['A'].plot()
<matplotlib.axes._subplots.AxesSubplot at 0x11ae7fc10>