1.实验目的
(1)对数据进行分析,以找出哪些变量对员工保留有直接和明显的影响(即它们是离开公司还是继续工作)
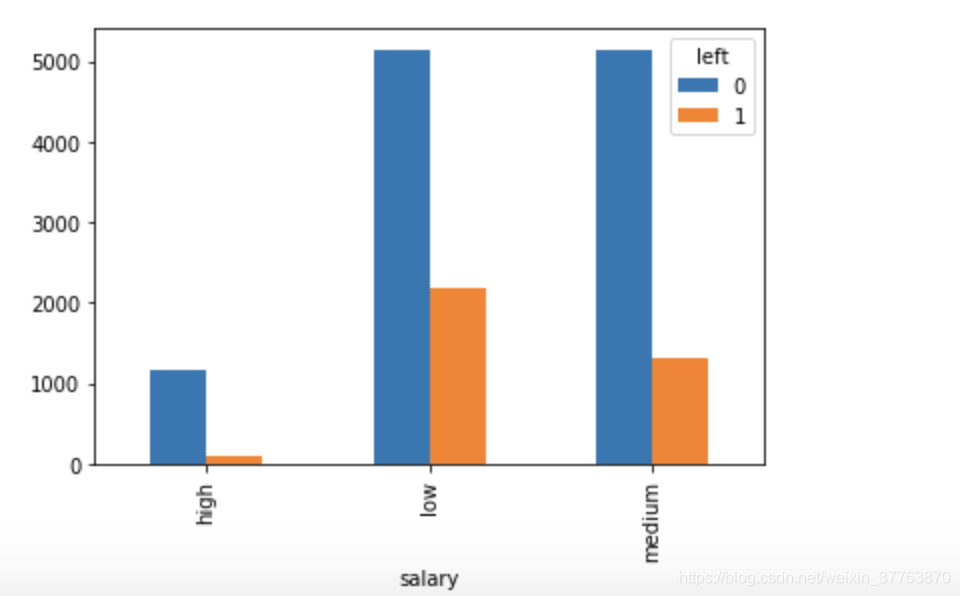
(2)绘制条形图,显示员工工资对保留率的影响
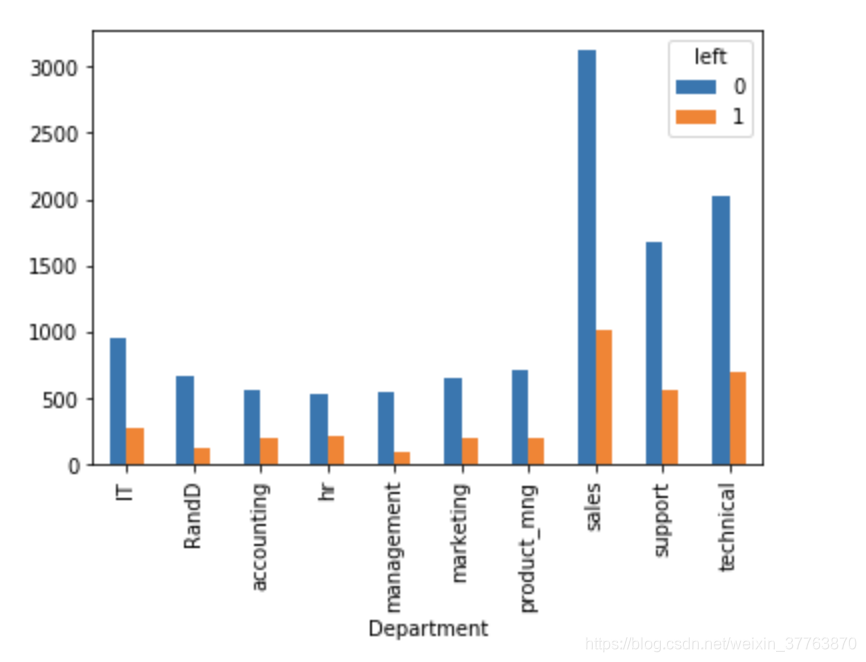
绘制条形图,显示部门和员工保留之间的相关性
(3)构建逻辑回归模型并计算模型的准确性
2.导入必要模块并读取数据
import pandas as pd
import matplotlib.pyplot as plt
%matplotlib inline

df = pd.read_csv('HR_comma_sep.csv')
df.shape    #14999条数据,10个字段
left = df[df.left==1]     #离职
left.shape
retained = df[df.left==0]   #在职
retained.shape
3.可视化分析数据
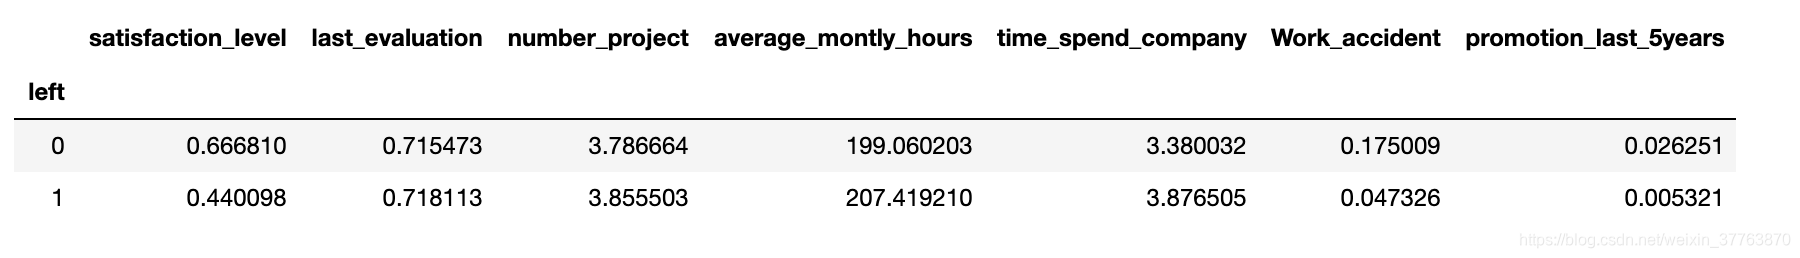
df.groupby('left').mean()     #按是否离职对数据分组
#0表示在职,1表示离职
pd.crosstab(df.salary,df.left).plot(kind='bar') #比较薪水对员工离职的影响
pd.crosstab(df.Department,df.left).plot(kind='bar') #比较不同部门对员工离职的影响
4.数据预处理
subdf = df[['satisfaction_level','average_montly_hours','promotion_last_5years','salary']] #提取5个影响因素
subdf.head()
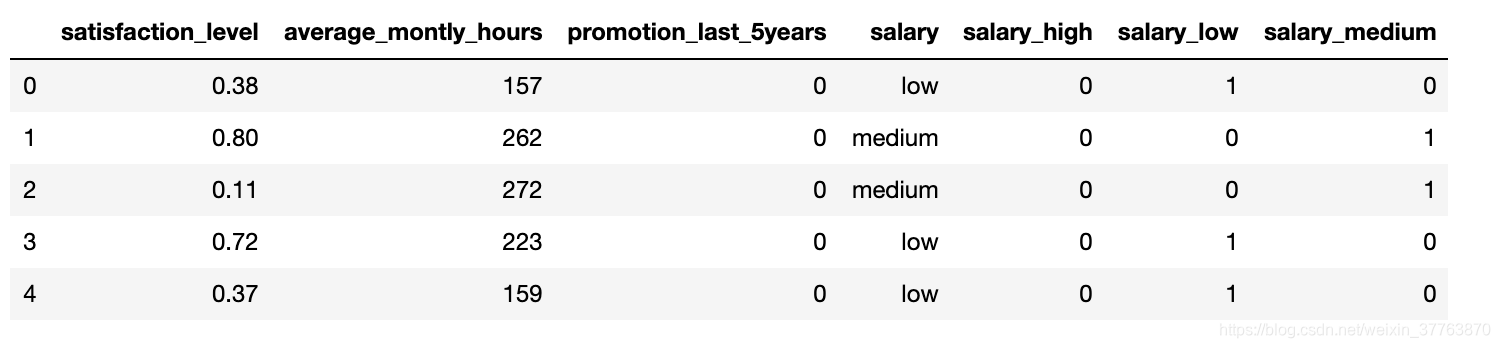
salary_dummies = pd.get_dummies(subdf.salary,prefix='salary') #将salary字段数字化 ,转化后的字段加前缀salary
df_with_dummies = pd.concat([subdf,salary_dummies],axis='columns') #拼接字段
df_with_dummies.head()
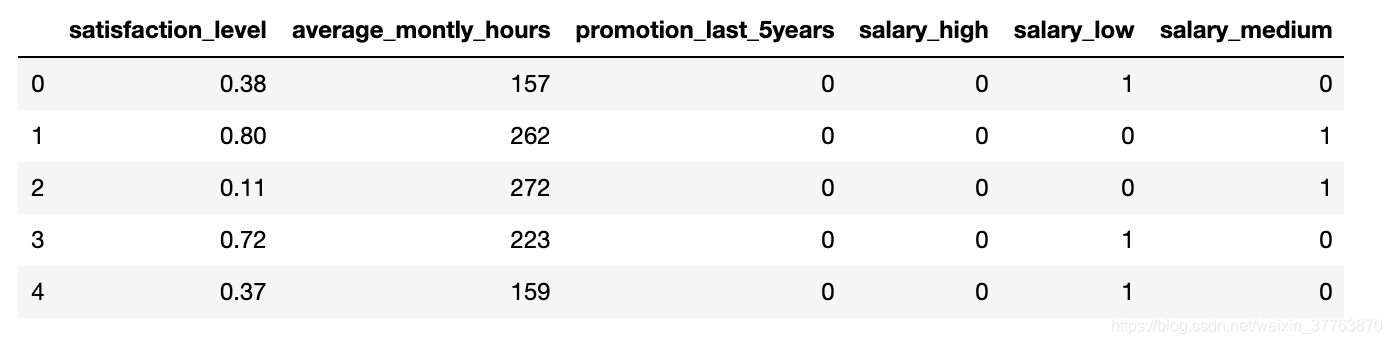
df_with_dummies.drop('salary',axis='columns',inplace=True)   #删除原salary字段
df_with_dummies.head()
X = df_with_dummies    #数据
y = df.left      #标签
5.训练+预测
from sklearn.model_selection import train_test_split
from sklearn.linear_model import LogisticRegression #导入逻辑回归模块
X_train, X_test, y_train, y_test = train_test_split(X,y,test_size=0.2)
model = LogisticRegression() #实例化模型
model.fit(X_train, y_train) #训练
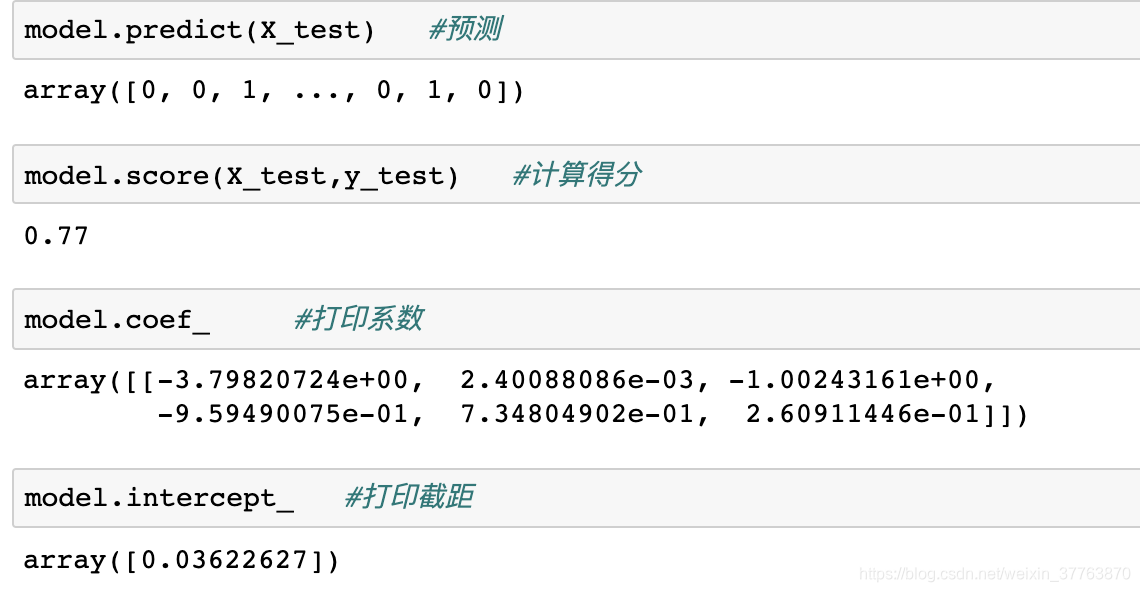
model.predict(X_test) #预测
model.score(X_test,y_test) #计算得分
model.coef_ #打印系数
model.intercept_ #打印截距