多系列柱状图大部分与多系列折线图相似
一、简单html布局
简单的html如下:
<!DOCTYPE html><html lang="en" dir="ltr">

<head>

<meta charset="utf-8">

<title>多系列柱状图</title>

</head>

<style type="text/css">

*{

padding: 0;

margin:0 auto;

}

.wrapper{

width: 1100px;

height: auto;

background: white;

}

#container{

width: 960px;

height:500px;

margin-top:5%;

/* background:red; */

}

</style>

<body>

<div class="wrapper">

<div id="container"> </div>

</div>

</body>


<script type = "text/javascript" src="./js/jquery.js"></script>

<script type = "text/javascript" src="./js/echarts.min.js"></script>

<script type = "text/javascript">

$(document).ready(function(){

}

</script></html>
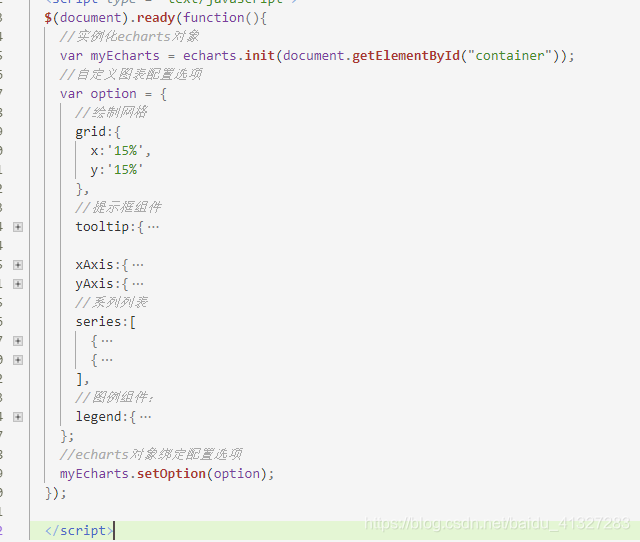
二、实例化echarts对象
$(document).ready(function(){

    //实例化echarts对象

    var myEcharts = echarts.init(document.getElementById("container"));

    //自定义图表配置选项

    var option = {


    };

    //echarts对象绑定配置选项

    myEcharts.setOption(option);

});![]() 三、设置图表配置选项option
三、设置图表配置选项option
1、绘制网格
var option = {

    //绘制网格
    grid:{

        x:'15%',

        y:'15%'

    }

};
2、绘制x、y轴(写在option对象中,下列步骤同此处)
        xAxis:{
            //是否显示x轴
            show:true,
            //类型:类目轴
            type:'category',
            //坐标轴刻度设置,
            axisTick:{
                //设置刻度线与标签对齐
                alignWithLabel:true
                },
            axisLine:{
                show:true,
                lineStyle:{
                    //轴线颜色
                    color: '#92adce',
                    //线型
                    type:'solid'
                    }
                },
            //设置坐标轴文字样式
            axisLabel:{
                //文字旋转:正值是逆时针,负值顺时针,此处逆时针旋转45
                rotate: 45
            },
            data:['2019-01','2019-02','2019-03','2019-04','2019-05','2019-06']
            },
        yAxis:{
            type:'value',
            //是否显示y轴
            show:true,
            axisLine:{
                show:true,
                lineStyle:{
                    //轴线颜色
                    color: '#92adce',
                    //线型
                    type:'solid'
                    }
                }
            },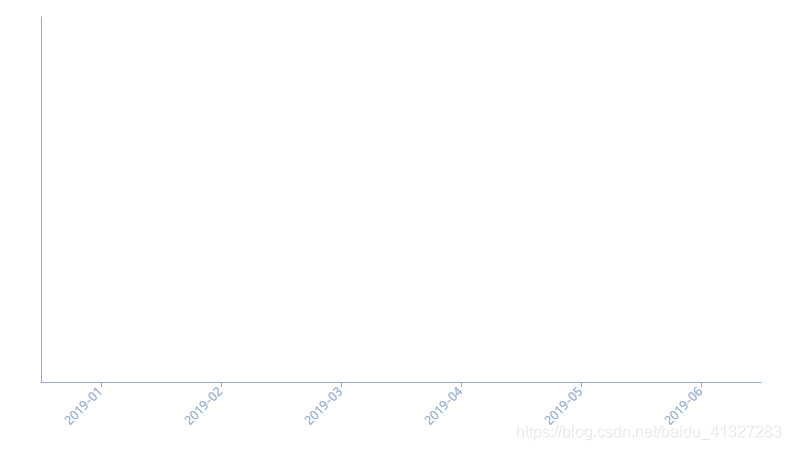
![]()
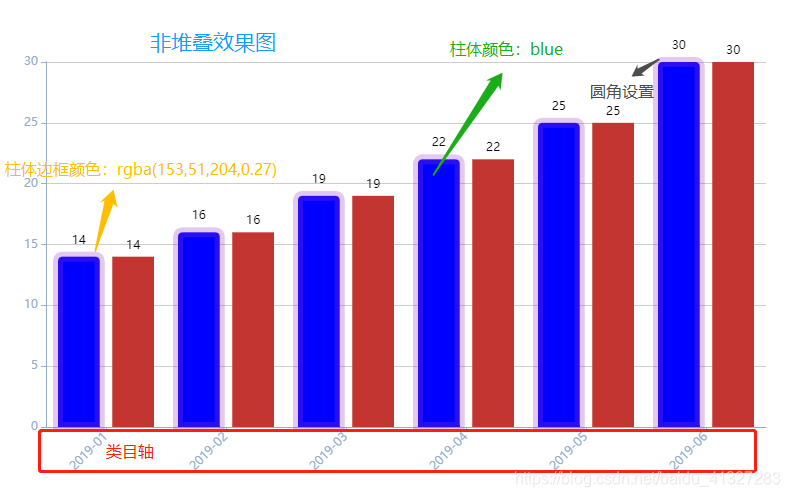
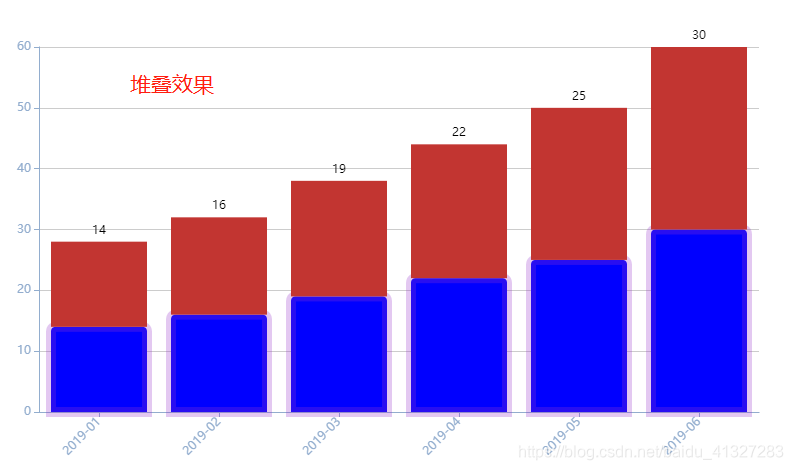
3、设置系列
//系列列表
series:[
{
//系列名称
name:'测试系列1',
//类型:折线图
type:'bar',
//数据堆叠,同个类目轴上系列配置相同的stack值可以堆叠放置。
// stack:'test',
//在柱体上显示对应数值
label:{
normal:{
//是否显示
show:true,
//显示位置:在标记图形的上方
position:'top',
//文本颜色:黑色,不设置默认为系列色
color:'black'
}
},
//柱体样式
itemStyle:{
normal:{
//柱体颜色
color: 'blue',
//柱体边框颜色
borderColor:'rgba(153,51,204,0.27)',
//柱体边框宽度
borderWidth:10,
//圆角设置,(顺时针左上:5,右上:5,右下:0,左下:0)
barBorderRadius: [5, 5, 0, 0]
}
},
data: [14,16,19,22,25,30]
},
{
//系列名称
name:'测试系列2',
//类型:折线图
type:'bar',
//数据堆叠,同个类目轴上系列配置相同的stack值可以堆叠放置。
stack:'test',
//在标记图形上显示对应数值
label:{
normal:{
//是否显示
show:true,
//显示位置:在标记图形的上方
position:'top',
//文本颜色:黑色,不设置默认为系列色
color:'black'
}
},
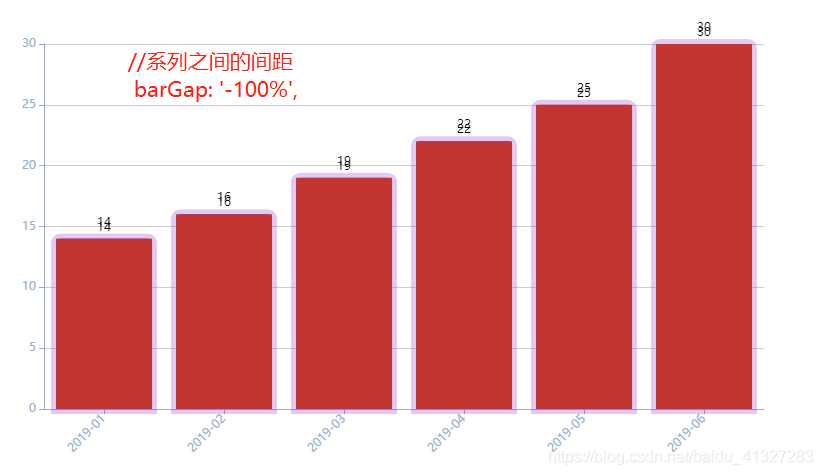
//系列之间的间距
// barGap: '-100%',
data: [14,16,19,22,25,30]
}
], 
使用数据集(dataset)管理系列要显示的数值
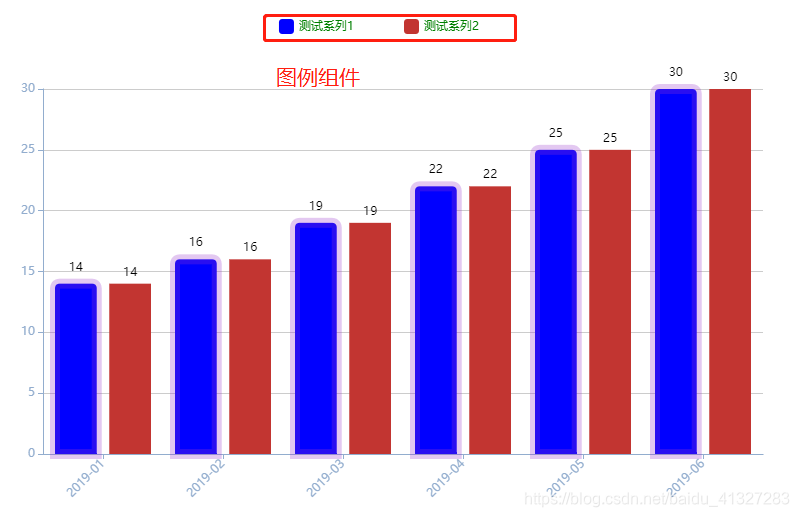
4、设置图例组件:展示不同系列的标记,颜色和名字
        //图例组件:
        legend:{
            data:['测试系列1','测试系列2'],
            //统一设置系列样式
            textStyle:{
                fontSize:'12',
                color:'green'
                },
                //系列之间的间距
                itemGap:50,
                //系列标记图形的宽高
                itemWidth:15,
                itemHeight:15
}![]()
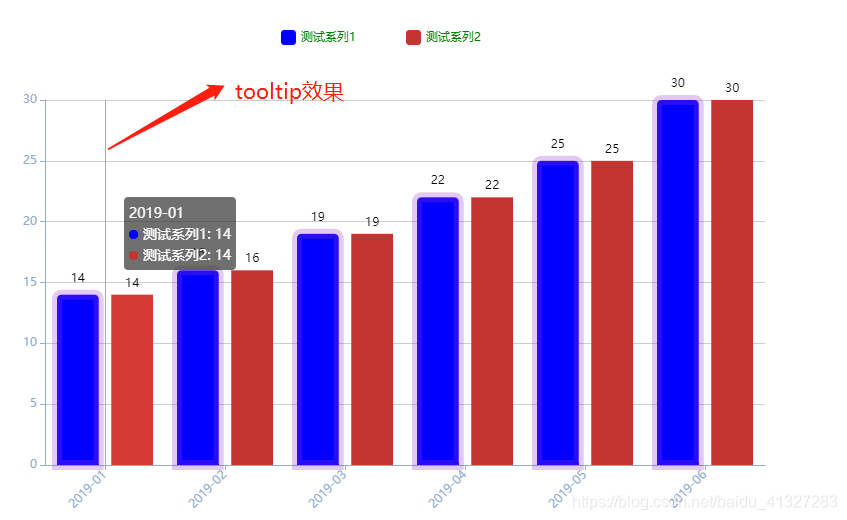
5、添加提示框组件tooltip
    //提示框组件
      tooltip:{
        //触发类型:坐标轴触发
        trigger:'axis'

},![]()
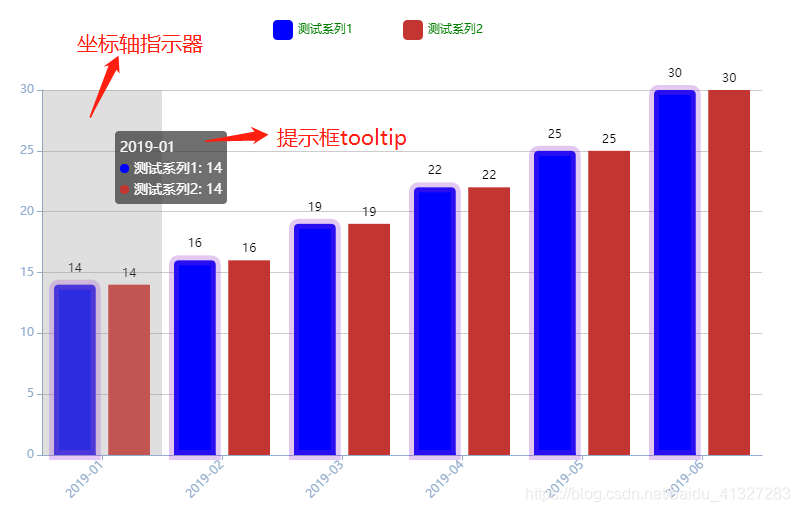
进一步更改:
    //提示框组件
      tooltip:{
        //触发类型:坐标轴触发
        trigger:'axis',
        //坐标轴指示器:指示坐标轴当前刻度的工具。
        axisPointer: {
            type: 'shadow',
            //可指定显示哪个轴的axisPointer,这里指定x轴
            axis:'x'
        }
      },
6、完整代码
<!DOCTYPE html>
<html lang="en" dir="ltr">
  <head>
    <meta charset="utf-8">
    <title>多系列柱状图</title>
  </head>
  <style type="text/css">
    *{
      padding: 0;
      margin:0 auto;
    }
    .wrapper{
      width: 1100px;
      height: auto;
      background: white;
    }
    #container{
      width: 960px;
      height:500px;
      margin-top:5%;
      /* background:red; */
    }
  </style>
  <body>
    <div class="wrapper">
      <div id="container"> </div>
    </div>
  </body>

  <script type = "text/javascript" src="./js/jquery.js"></script>
  <script type = "text/javascript" src="./js/echarts.min.js"></script>
  <script type = "text/javascript">
  $(document).ready(function(){
    //实例化echarts对象
    var myEcharts = echarts.init(document.getElementById("container"));
    //自定义图表配置选项
    var option = {
      //绘制网格
      grid:{
        x:'15%',
        y:'15%'
      },
      //提示框组件
      tooltip:{
        //触发类型:坐标轴触发
        trigger:'axis',
        //坐标轴指示器:指示坐标轴当前刻度的工具。
        axisPointer: {
            type: 'shadow',
            //可指定显示哪个轴的axisPointer,这里指定x轴
            axis:'x'
        }
      },

      xAxis:{
        //是否显示x轴
        show:true,
        //类型:类目轴
        type:'category',
        //坐标轴刻度设置,
        axisTick:{
          //设置刻度线与标签对齐
          alignWithLabel:true
        },
        axisLine:{
          show:true,
          lineStyle:{
            //轴线颜色
            color: '#92adce',
            //线型
            type:'solid'
          }
        },
        //设置坐标轴文字样式
        axisLabel:{
            //文字旋转:正值是逆时针,负值顺时针,此处逆时针旋转45
            rotate: 45
        },
        data:['2019-01','2019-02','2019-03','2019-04','2019-05','2019-06']
      },
      yAxis:{
        type:'value',
            //是否显示y轴
        show:true,
        axisLine:{
          show:true,
          lineStyle:{
            //轴线颜色
            color: '#92adce',
            //线型
            type:'solid'
          }
        }
      },
      //系列列表
      series:[
        {
          //系列名称
          name:'测试系列1',
          //类型:折线图
          type:'bar',
          //数据堆叠,同个类目轴上系列配置相同的stack值可以堆叠放置。
          // stack:'test',
          //在柱体上显示对应数值
          label:{
            normal:{
              //是否显示
              show:true,
              //显示位置:在标记图形的上方
              position:'top',
              //文本颜色:黑色,不设置默认为系列色
              color:'black'
            }
          },
          //柱体样式
          itemStyle:{
            normal:{
              //柱体颜色
              color: 'blue',
              //柱体边框颜色
              borderColor:'rgba(153,51,204,0.27)',
              //柱体边框宽度
              borderWidth:10,
              //圆角设置,(顺时针左上:5,右上:5,右下:0,左下:0)
              barBorderRadius: [5, 5, 0, 0]
            }
          },
          data: [14,16,19,22,25,30]
        },
        {
          //系列名称
          name:'测试系列2',
          //类型:折线图
          type:'bar',
          //数据堆叠,同个类目轴上系列配置相同的stack值可以堆叠放置。
          stack:'test',
          //在标记图形上显示对应数值
          label:{
            normal:{
              //是否显示
              show:true,
              //显示位置:在标记图形的上方
              position:'top',
              //文本颜色:黑色,不设置默认为系列色
              color:'black'
            }
          },
          //系列之间的间距
          // barGap: '-100%',
          data: [14,16,19,22,25,30]
        }
      ],
      //图例组件:
      legend:{
        data:['测试系列1','测试系列2'],
          //统一设置系列样式
        textStyle:{
          fontSize:'12',
           color:'green'
        },
        //系列之间的间距
        itemGap:50,
        //系列标记图形的宽高
        itemWidth:15,
        itemHeight:15
      }
    };
    //echarts对象绑定配置选项
    myEcharts.setOption(option);
  });

  </script>
</html>
忘了自己的echarts是什么版本的可以在控制台打印:
console.log(echarts.version);