-
npm下载echarts
-
项目中引入
import * as echarts from "echarts"; -
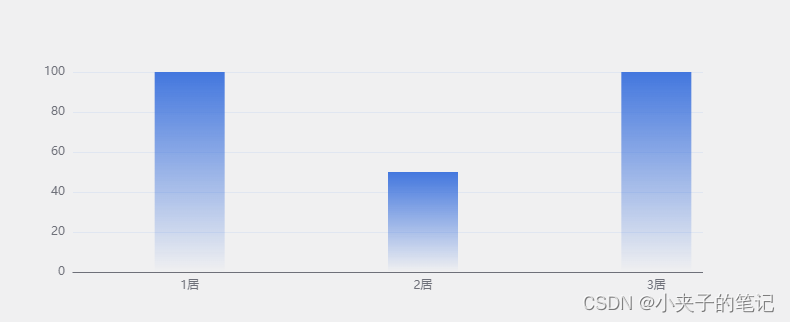
完成效果:
-
代码
// An highlighted block
<template>
  <div ref="container" :style="{ width: '90%', height: '100%' }"></div>
</template>
<script>
import * as echarts from "echarts";
import {

     onMounted, ref } from "vue";
export default {


  setup() {


    const container = ref(null);
    onMounted(() => {


      const chart = echarts.init(container.value, {


        width: "700px",
        height: "200px",
      });
    chart.setOption({


          xAxis: {


            type: "category",
             // 数据的一种形式 1
            // data: ["一居", "一居", "一居"],
            axisTick: {


              length: 0,
            },
          },
          yAxis: {


            type: "value",
            // min: 0,
            // max: 200,
          },
          series: [
            {


              //   data: [80, 70, 100],
              type: "bar",
              barWidth: "30%",
              itemStyle: {


                color: new echarts.graphic.LinearGradient(0, 0, 0, 1, [
                  {


                    offset: 0,
                    color: "rgba(67, 119, 222, 1)",
                  },
                  {


                    offset: 1,
                    color: "rgba(67, 119, 222, 0)",
                  },
                ]),
              },
            },
          ],
          dataset: [
            // 数据的一种形式 2
            // {


            //   source: {


            //     product: ["1居", "2居", "3居"],
            //     count: [823, 235, 1042],

            //   },
            // },
            // 数据的一种形式 3
            {


              source: [
                {

     product: "1居", count: 100 },
                {

     product: "2居", count: 50 },
                {

     product: "3居", count: 100 },
              ],
            },
          ],
        });

      window.addEventListener("resize", () => chart.resize(), false);
    });

    return {

     container };
  },
};
</script>
-
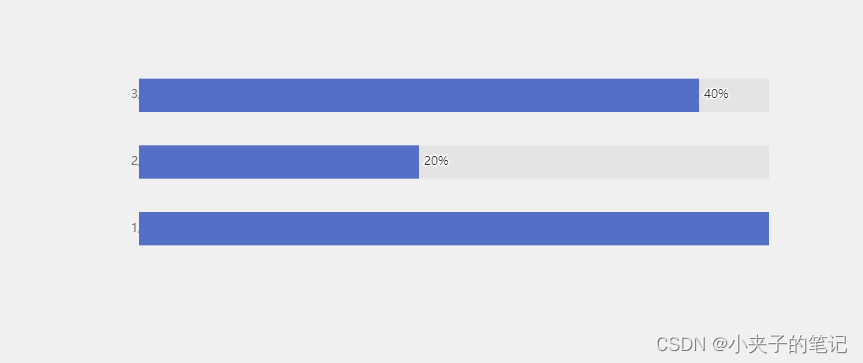
横着的柱状图
-
代码
// An highlighted block
   chart.setOption({


          yAxis: {


            type: "category",
            name: props.title,
            data: ["1居", "2居", "3居"],
            axisLine: {


              show: false,
            },
            axisTick: {


              show: false,
            },
            axisLabel: {


              textStyle: {


                align: "bottom",
                baseline: "middle",
              },
              normal: {


                show: true,
                position: [0, "20"],
              },
            },
          },

          xAxis: {


            show: false,
          },
          series: [
            {


              showBackground: true,
              type: "bar",
              barWidth: "50%",
              data: [50, 20, 40],
              label: {


                  show: true,
                  position: "right",
                  valueAnimation: true,
              },

              itemStyle: {


                normal: {


                  label: {


                    show: true,
                    position: "right",
                    formatter: "{c}%",
                  },
                },

                // color: "rgba(67, 119, 222, 1)",
                color: new echarts.graphic.LinearGradient(0, 0, 0, 1, [
                  {


                    offset: 0,
                    color: "rgba(67, 119, 222, 1)",
                  },
                  {


                    offset: 1,
                    color: "rgba(67, 119, 222, 0.5)",
                  },
                ]),
              },
            },
          ],
          dataset: [
            // {


            //   source: {


            //     product: ["1居", "2居", "3居"],
            //     count: [823, 235, 1042],
            //   },
            // },
            {


              source: [
                {

     product: "1居", count: 100 },
                {

     product: "2居", count: 50 },
                {

     product: "3居", count: 100 },
              ],
            },
          ],
        });