继续学习机器学习:监督模型中的回归模型
书上使用的是scikit-learn中的fit函数来实现线性回归模型
目标:根据训练数据来训练一个回归模型,从而预测测试数据,并且对预测对精准度进行分析
step1:载入数据集
感谢万能的sklearn,在datasets中有波士顿房价的数据
import numpy as np
from sklearn import datasets
from sklearn import metrics
from sklearn import model_selection as modsel
from sklearn import linear_model
import matplotlib.pyplot as plt
plt.style.use('ggplot')

boston = datasets.load_boston()
print(dir(boston))
print(boston.data.shape)
print(boston.target.shape)
step2:训练模型
先将数据集分类为训练数据和测试数据两部分,一般测试数据占所有数据集的10%-30%
# 将数据集分为训练数据集和测试数据集,一般保留10%-30%的数据用于测试比较合适
# 将数据集分割成训练数据和测试数据
x_train, x_test, y_train, y_test = modsel.train_test_split(
	boston.data, boston.target, test_size=0.1,
	random_state = 42
)
接下来使用sklearn中的fit,同时计算训练得到的预测值的均值方差和确定系数
linreg = linear_model.LinearRegression()
linreg.fit(x_train, y_train)
# 通过计算真实房价和预测结果的差值,可以得到预测值的均值方差
# linreg.predict(x_train) 是预测值
print('预测值的方差:\t' +
	str(metrics.mean_squared_error(y_train, linreg.predict(x_train))))
print('预测值的确定系数(R方值):\t' + str(linreg.score(x_train, y_train)))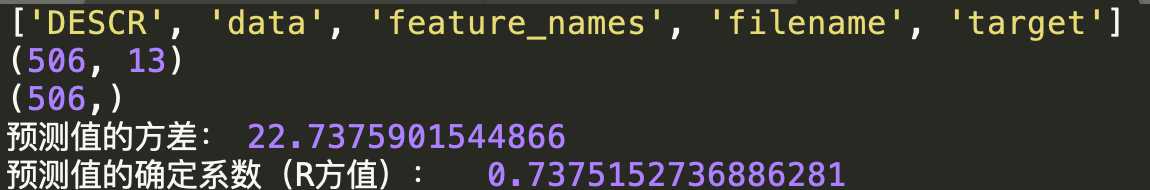
step3:测试模型
使用测试数据来测试模型linreg,同时使用matplotlib显示出拟合关系
# step3:测试模型
y_pred = linreg.predict(x_test)
print('在测试数据上进行预测得到的方差:\t' + str(metrics.mean_squared_error(y_test, y_pred)))
# 画出测试数据的真实值和模型的预测值的拟合图像
plt.figure(figsize=(10, 6))
plt.plot(y_test, linewidth=3, label='truth')
plt.plot(y_pred, linewidth=3, label='predict')
plt.legend(loc='best')
plt.xlabel('data_points')
plt.ylabel('target_value')
plt.show()
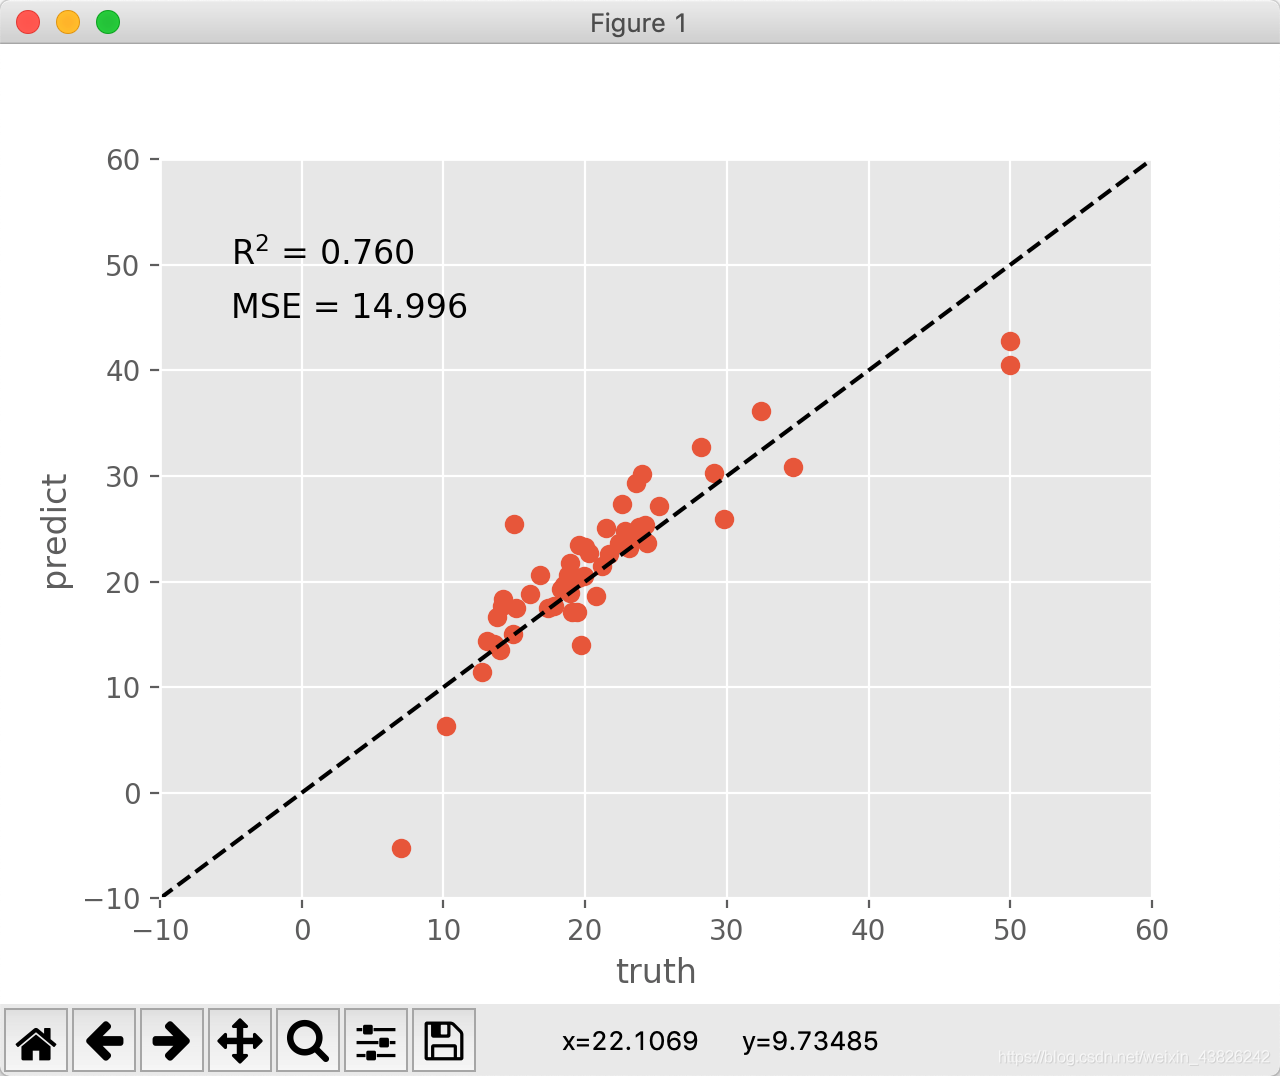
step4:进一步显示训练模型的拟合度
使用matplotlib换成另一种形式来更好地显示拟合度
# step4:形式化数据方差的数量 - 进一步显示模型的拟合度
plt.plot(y_test, y_pred, 'o')
plt.plot([-10, 60], [-10, 60], 'k--')
plt.axis([-10, 60, -10, 60])
plt.xlabel('truth')
plt.ylabel('predict')

# 产生一个文本框来显示方差
scorestr = r'R$^2$ = %.3f' % linreg.score(x_test, y_test)
errstr = 'MSE = %.3f' % metrics.mean_squared_error(y_test, y_pred)
plt.text(-5, 50, scorestr, fontsize=12)
plt.text(-5, 45, errstr, fontsize=12)
plt.show()