ggplot2是R语言的绘图包
library('ggplot2')
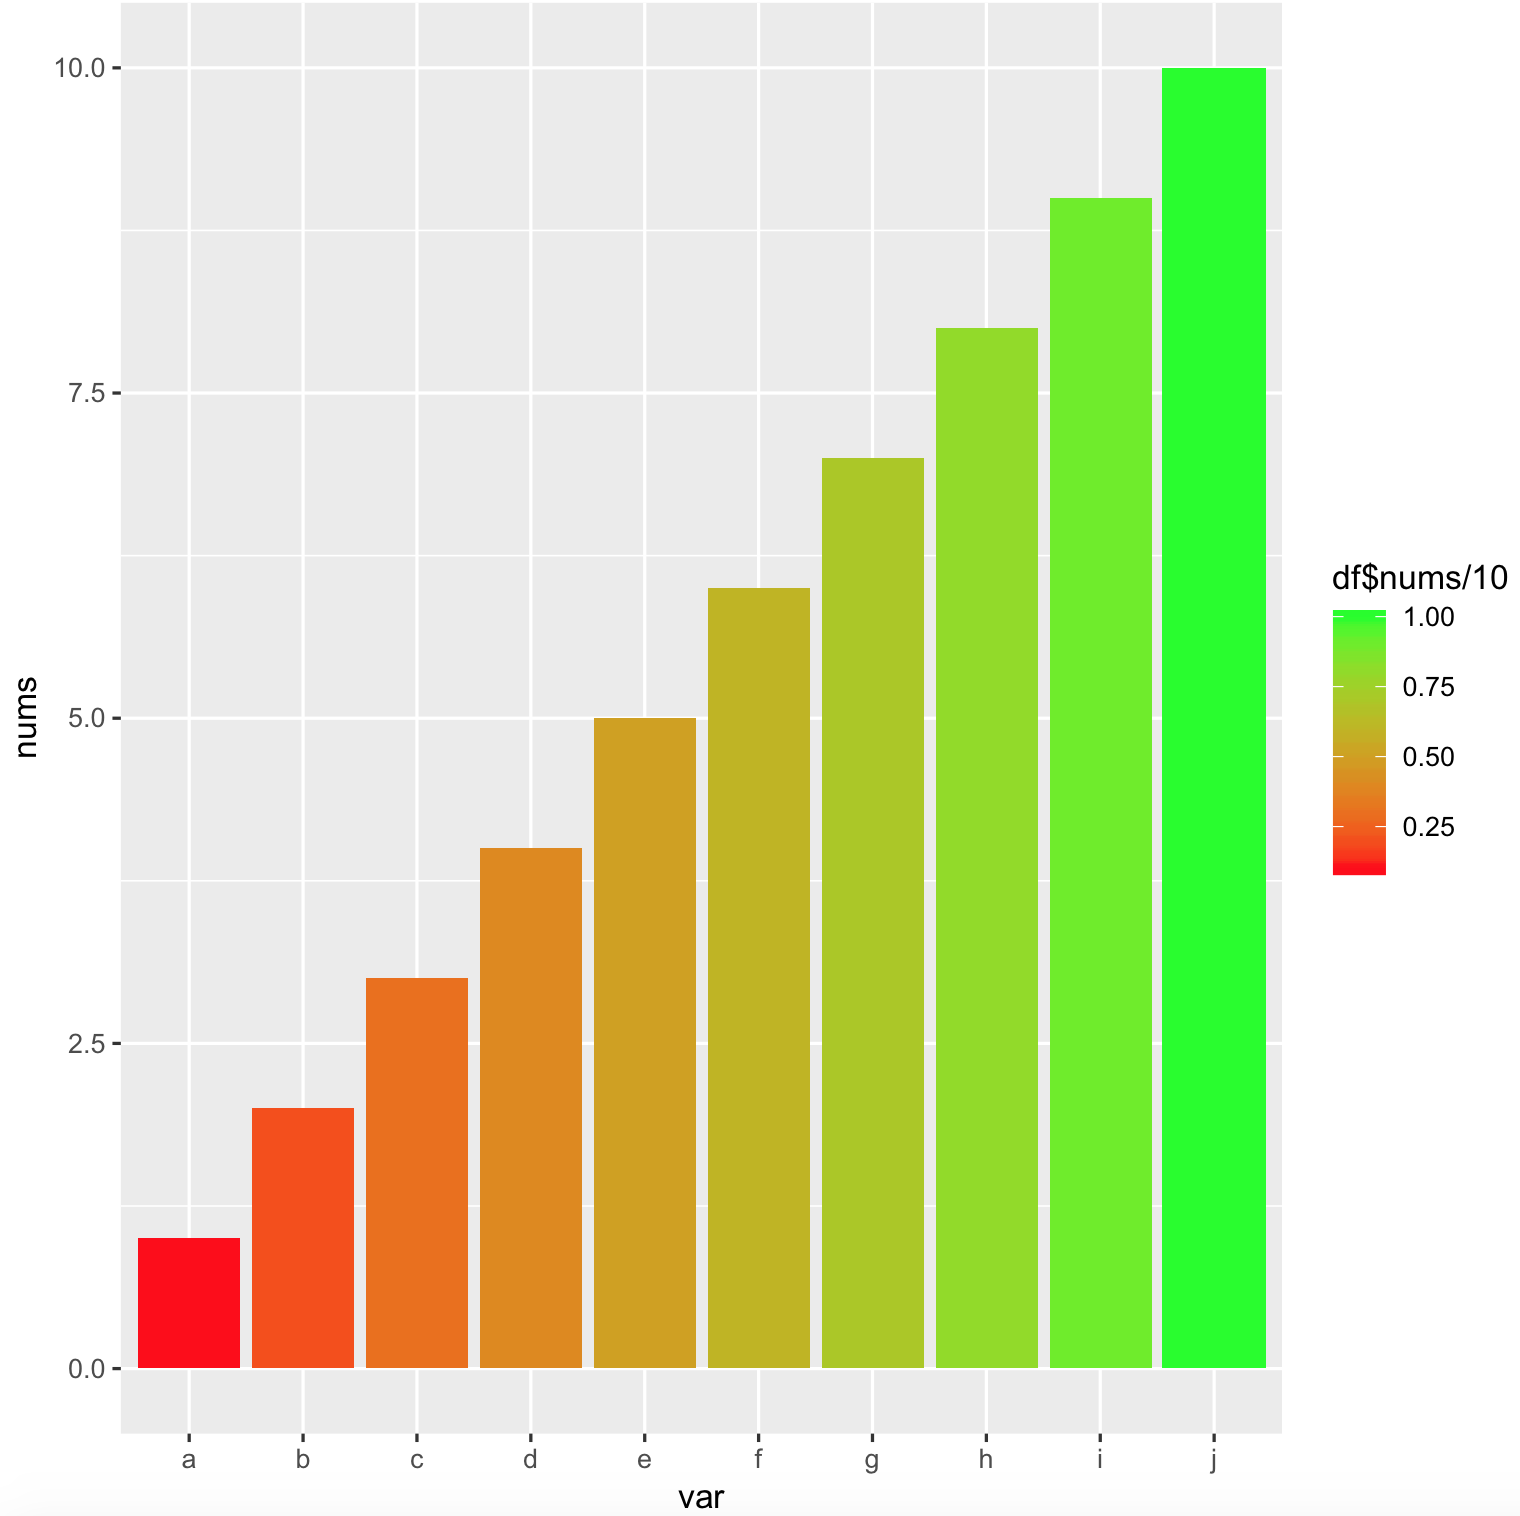
df <- data.frame(var=c("a","b","c","d","e","f","g","h","i","j"), nums=c(1:10))
# fill group should be within [0,1]
plot2 <- ggplot(df, aes(x=var, y=nums, fill= df$nums/10)) + geom_col() + scale_fill_gradient(low="red", high="green")
print(plot2)效果图: