这是ggplot的官网(http://ggplot.yhathq.com/),非常类似R里的ggplot2,有点遗憾的是好像2016年后就没更新了。
简单示例:
import pandas as pd
from ggplot import *
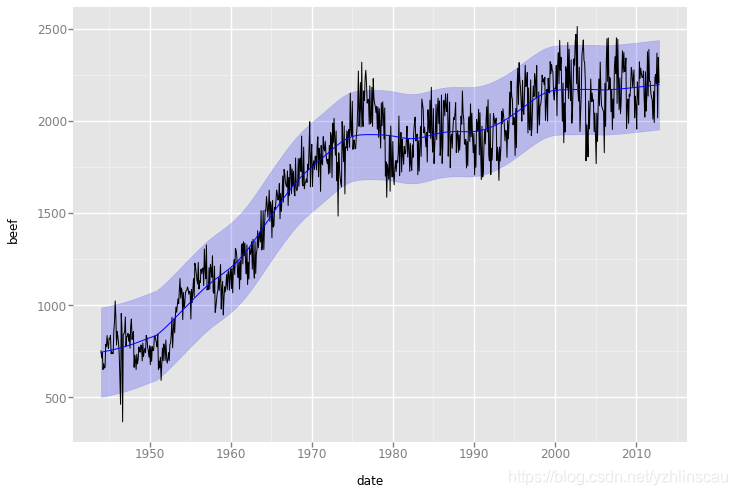
ggplot(aes(x='date', y='beef'), data=meat) +\
geom_line() +\
scale_x_date(labels = date_format("%Y"))+\
stat_smooth(color='blue', span=0.2,method='loess')生成图形如下:
简单示例2:
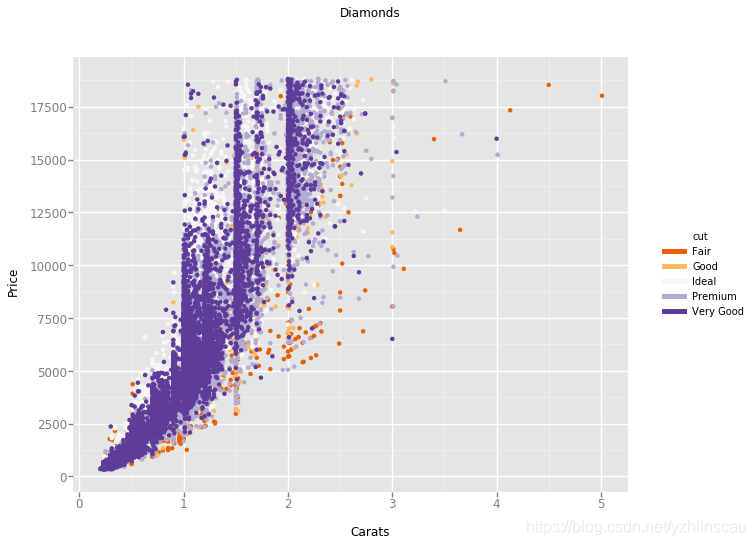
ggplot(diamonds, aes(x='carat', y='price', color='cut')) +\
    geom_point() +\
    scale_color_brewer(type='diverging', palette=4) +\
    xlab("Carats") + ylab("Price") + ggtitle("Diamonds")
生成图形如下:
ggplot在python中的安装方法:
$ pip install -U ggplot
# or
$ conda install -c conda-forge ggplot
# or
pip install git+https://github.com/yhat/ggplot.git
不过ggplot在使用过程中会出现一些,原因应该是ggplot没更新造成的,很多其它python包已经升级了。
问题1:
AttributeError: module 'pandas' has no attribute 'tslib'
解决方法:
#1. Change `pandas.tslib.Timestamp` to `pandas.Timestamp` (in utils.py and stats/smoothers.py)
#2. Change `from pandas.lib import Timestamp` to `from pandas import Timestamp`. (in smoothers.py)
问题2:
AttributeError: 'DataFrame' object has no attribute 'sort'
解决方法:
#Change `smoothed_data.sort('x')` to `smoothed_data.sort_values('x')` (in stat_smooth.py)
