vue页面中使用折线图,并且有时间段筛选。因此就需要用到横坐标的拖拽功能。
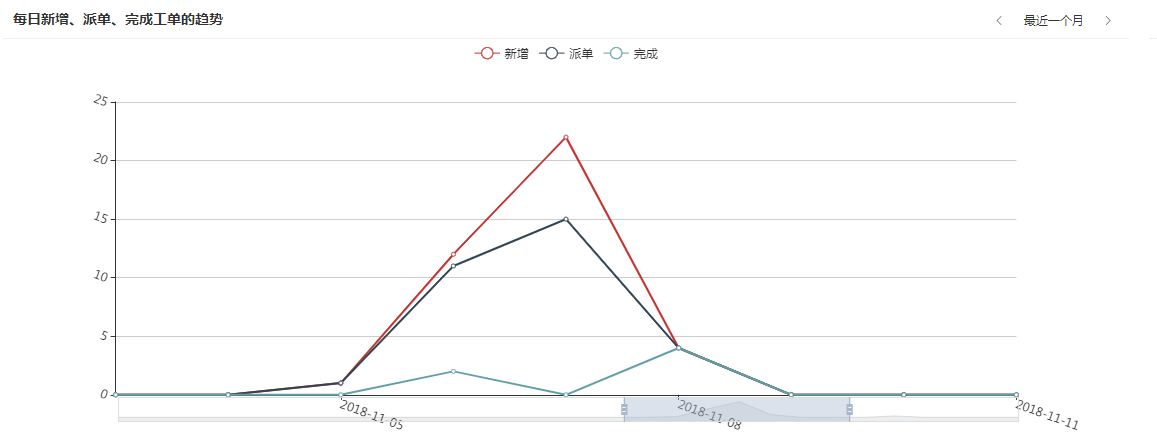
界面效果如下:
现在来看这个效果的实现代码:
 drawLine() {
      let that = this,
        lineDate = [],
        dispatchCount = [],
        finishCount = [],
        newCount = [];

      let param = {
        // 参数
      };
      axios
        .post(url, param)
        .then(function(response) {
          let rs = response.data.data;
          if (rs != undefined && rs != [] && rs != null) {
            for (let i = 0; i < rs.dispatch.length; i++) {
              lineDate.push(rs.dispatch[i].day);
              dispatchCount.push(rs.dispatch[i].count);
            }
            for (let i = 0; i < rs.finish.length; i++) {
              finishCount.push(rs.finish[i].count);
            }
            for (let i = 0; i < rs.new.length; i++) {
              newCount.push(rs.new[i].count);
            }
          }

          let lineChart = that.$echarts.init(
            document.getElementById("lineChart")
          );

          lineChart.setOption({
            tooltip: {
              trigger: "axis"
            },
            legend: {
              data: ["新增", "派单", "完成"]
            },
            grid: {
              left: "10%", //因旋转导致名字太长的类目造成遮蔽,可以配合这两个属性
              bottom: "10%" // 分别表示:距离左边距和底部的距离,具体数值按实际情况调整
            },

            xAxis: {
              type: "category",
              boundaryGap: false,
              data: lineDate,
              axisLabel: {
                interval: 2, //0:全部显示,1:间隔为1显示对应类目,2:依次类推,(简单试一下就明白了,这样说是不是有点抽象)
                rotate: -20 //倾斜显示,-:顺时针旋转,+或不写:逆时针旋转
              }
            },
            yAxis: {
              type: "value",
              axisLabel: {
                // formatter: function(v) {
                //   return parseInt(v); // 让y坐标数组为整数
                // },
                 rotate: -20
              },

            },
            // x轴拖动
            dataZoom: [
              {
                type: "slider",
                realtime: true, //拖动滚动条时是否动态的更新图表数据
                height: 25, //滚动条高度
                start: 40, //滚动条开始位置(共100等份)
                end: 65 //结束位置(共100等份)
              }
            ],

            series: [
              {
                name: "新增",
                type: "line",
                data: newCount
              },
              {
                name: "派单",
                type: "line",
                data: dispatchCount
              },
              {
                name: "完成",
                type: "line",
                data: finishCount
              }
            ]
          });
        });
    },