版权声明:本文为博主原创文章,未经博主允许不得转载。 https://blog.csdn.net/wzyaiwl/article/details/83046352
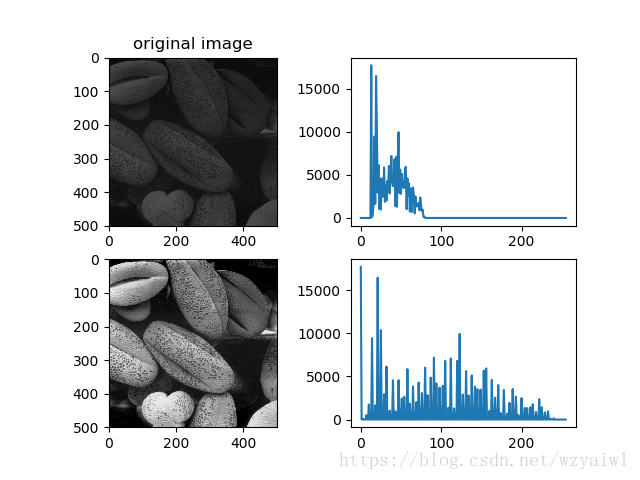
全局线性变换的公式是s = (r-a)*(d-c)/(b-a)+c,其中a、b是原图片的灰度最小值和最大值,c、d是变换后的灰度值的最小值和最大值。r是当前像素点的灰度值,s是当前像素点变换后的灰度值。该公式可自己画出一个坐标,利用相似三角形性质可轻易得出。所以只要我们得到一个图片的灰度范围,我们就可以自由变换到指定的灰度范围,这种灰度变换也是图像增强的一部分。下面的示例能清晰看出变换后的效果。除了图片的直观显示,我们还可以画出其变换前后的直方图来看出其差异。
代码如下:
import cv2
import matplotlib.pyplot as plt
# 统计各灰度值的像素个数
def histogram(image):
    (row, col) = image.shape
    hist = [0]*256
    for i in range(row):
        for j in range(col):
            hist[image[i,j]] +=1
    return hist

#全局灰度线性变换
def global_linear_transmation(img): #将灰度范围设为0~255
    maxV=img.max()
    minV=img.min()
    for i in range(img.shape[0]):
        for j in range(img.shape[1]):
            img[i,j] = ((img[i,j]-minV)*255)/(maxV-minV)
    return img

image0 = cv2.imread("rice.tif",0)
plt.figure()
plt.subplot(2,2,1)
#使用matplotlib中的imshow显示图像,注意参数的含义,不加参数试试
plt.imshow(image0,vmin=0, vmax=255,cmap = plt.cm.gray)
plt.title('original image')
image_hist0 = histogram(image0)
plt.subplot(2,2,2)
plt.plot(image_hist0)

image1=global_linear_transmation(image0)
plt.subplot(2,2,3)
plt.imshow(image1,vmin=0, vmax=255,cmap = plt.cm.gray)
image_hist1 = histogram(image1)#统计变换后图像的各灰度值像素的个数
plt.subplot(2,2,4)
plt.plot(image_hist1)
plt.show()
效果图如下: