先用matlab试试样本协方差:
>> X=[1,3;2,4;0,6]
X =
1 3
2 4
0 6
注意,行表示样本点,列表示属性列向量。以前使用matlab习惯用列向量表示点。
以下去除平均值、中心化(类似移动坐标系到样本质心)
>> removMeanX=X-[mean(X);mean(X);mean(X)]
removMeanX =
0 -1.3333
1.0000 -0.3333
-1.0000 1.6667
以下表示中心化前后样本协方差不变,注意样本协方差是对各属性列而言。
>> covX=cov(X)
covX =
1.0000 -1.0000
-1.0000 2.3333
>> covRemovMeanX=cov(removMeanX)
covRemovMeanX =
1.0000 -1.0000
-1.0000 2.3333
以下表示中心化后,样本协方差可用各属性列点积得到,默认的cov()得到的是样本无偏协方差。
(removMeanX'*removMeanX类似样本惯性矩阵,对角为惯性矩,其他为惯性积。)
>> covRemovMeanX_getByDot=removMeanX'*removMeanX/(3-1)
covRemovMeanX_getByDot =
1.0000 -1.0000
-1.0000 2.3333
>> [V,D]=eig(covRemovMeanX)
V =
-0.8817 -0.4719
-0.4719 0.8817
D =
0.4648 0
0 2.8685
>> V*D
ans =
-0.4098 -1.3535
-0.2193 2.5291
>> D*V
ans =
-0.4098 -0.2193
-1.3535 2.5291
>> covRemovMeanX*V
ans =
-0.4098 -1.3535
-0.2193 2.5291
(设样本中心化后坐标系为Er,惯性主坐标系为Ep,则V为Er到Ep的过渡矩阵,其列向量(特征向量)为Ep的单位基在Er下的投影坐标)
# coding=utf-8
'''
Created on Jun 1, 2011
@author: Peter Harrington
'''
from numpy import *
def loadDataSet(fileName, delim='\t'):
fr = open(fileName)
stringArr = [line.strip().split(delim) for line in fr.readlines()]
datArr = [list(map(float,line)) for line in stringArr]
return mat(datArr)
def pca(dataMat, topNfeat=9999999):
meanVals = mean(dataMat, axis=0)
meanRemoved = dataMat - meanVals #remove mean
covMat = cov(meanRemoved, rowvar=0)
eigVals,eigVects = linalg.eig(mat(covMat))
eigValInd = argsort(eigVals) #sort, sort goes smallest to largest
eigValInd = eigValInd[:-(topNfeat+1):-1] #cut off unwanted dimensions
redEigVects = eigVects[:,eigValInd] #reorganize eig vects largest to smallest
lowDDataMat = meanRemoved * redEigVects#transform data into new dimensions
reconMat = (lowDDataMat * redEigVects.T) + meanVals
return lowDDataMat, reconMat
dataMat=loadDataSet(r'C:\Users\li\Downloads\machinelearninginaction\Ch13\testSet.txt')
lowDMat,reconMat=pca(dataMat,1)
print(shape(lowDMat))
import matplotlib.pyplot as plt
fig=plt.figure()
ax=fig.add_subplot(111)
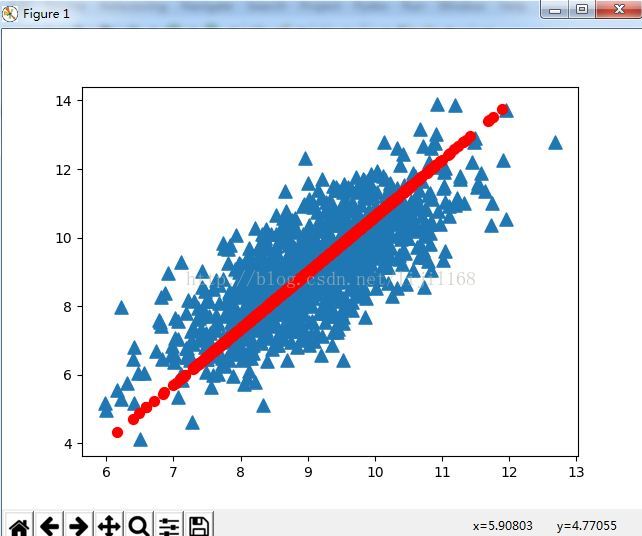
ax.scatter(dataMat[:,0].flatten().A[0],dataMat[:,1].flatten().A[0],marker='^',s=90)
ax.scatter(reconMat[:,0].flatten().A[0],reconMat[:,1].flatten().A[0],marker='o',s=50,c='red')
plt.show()